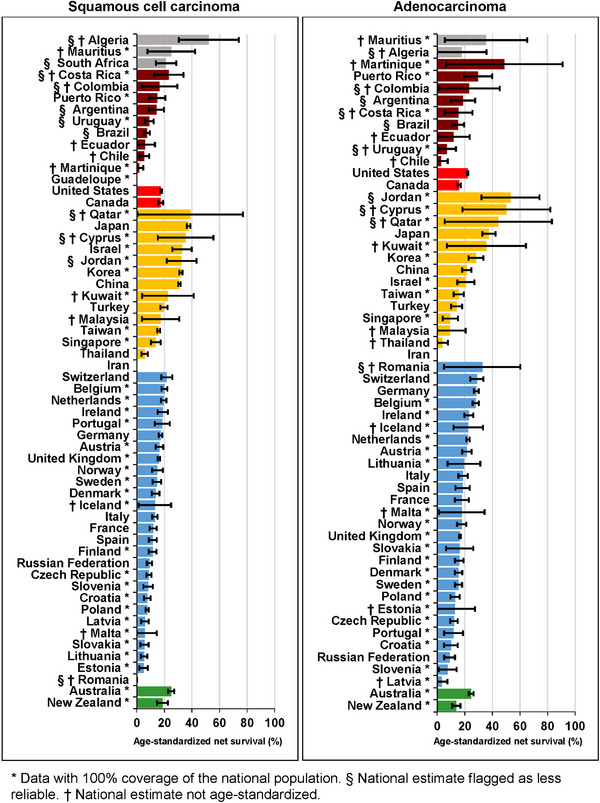
FIGURE 5.

Five‐year net survival (%) by morphological sub‐type and country: adults (15‐99 years) diagnosed with esophageal cancer during 2010‐2014.
* Data with 100% coverage of the national population. § National estimate flagged as less reliable. † National estimate not age‐standardized. The different colors represent the types of countries in terms of continental/geographical location, e.g., Africa, South America, North America, Asia, Middle East, Europe, etc.
