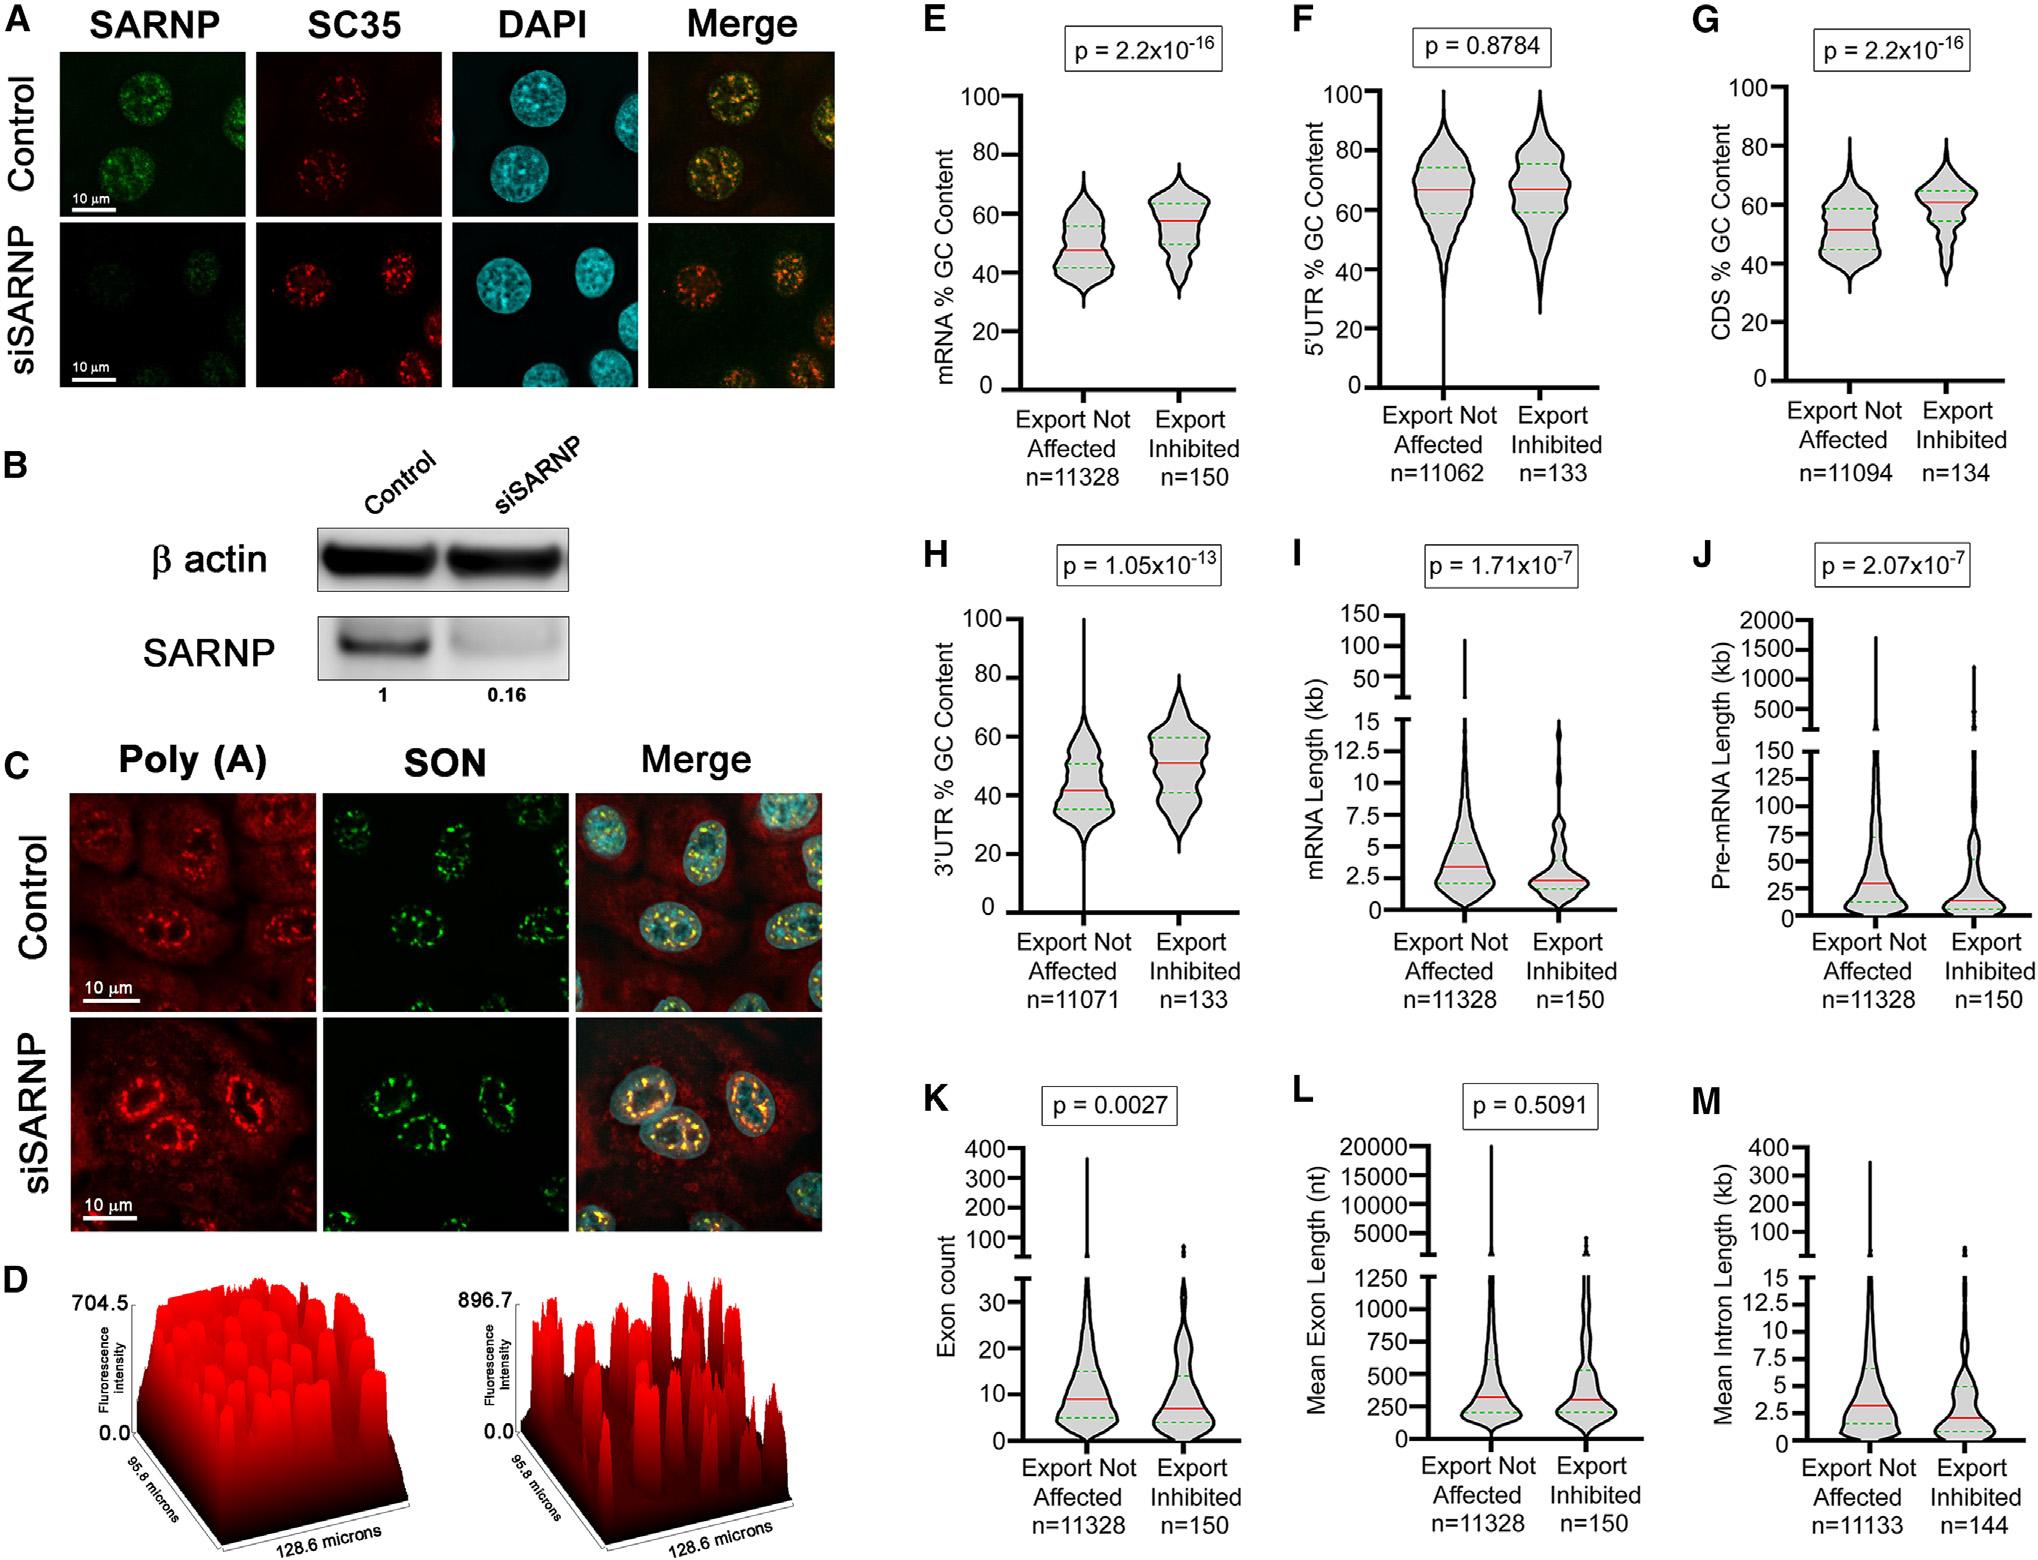
Figure 6. SARNP knockdown inhibits nuclear export of a subset of mRNAs with high GC content.

(A–D) A549 cells were transfected with nontargeting siRNAs or with siRNAs that target SARNP. After 48 h, cells were subjected to immunofluorescence microscopy (A) or western blot analysis (B) with the depicted antibodies or were subjected to RNA-FISH to detect the intracellular distribution of poly(A) RNA in control cells and in cells depleted of SARNP (C). The nuclear speckle assembly and splicing factor SON is used as a nuclear speckle marker. The graph in (D) depicts accumulation of poly(A) RNA at nuclear speckles upon SARNP depletion (right) compared to control cells (left). The surface plot tool of Fiji (ImageJ) was used to calculate the fluorescence intensity of poly(A) RNA.
(E–M) A549 cells were transfected with non-targeting siRNAs or with siRNAs that target SARNP. After 48 h, RNA was isolated from whole-cell, cytoplasmic, and nuclear fractions. RNA-seq data obtained from these samples in two biological replicates were analyzed to identify RNA features associated with cellular mRNAs that are dependent on SARNP for their nuclear export. Violin plots show the distribution of RNA features between exports not affected (left) and export-inhibited (right) transcripts upon SARNP knockdown. The red line indicates the median, and the green line indicates quartiles. Mann-Whitney U rank test was used to calculate statistical significance. p values are shown on the top of each plot. Number of transcripts in each group (n) is mentioned below the graphs.
