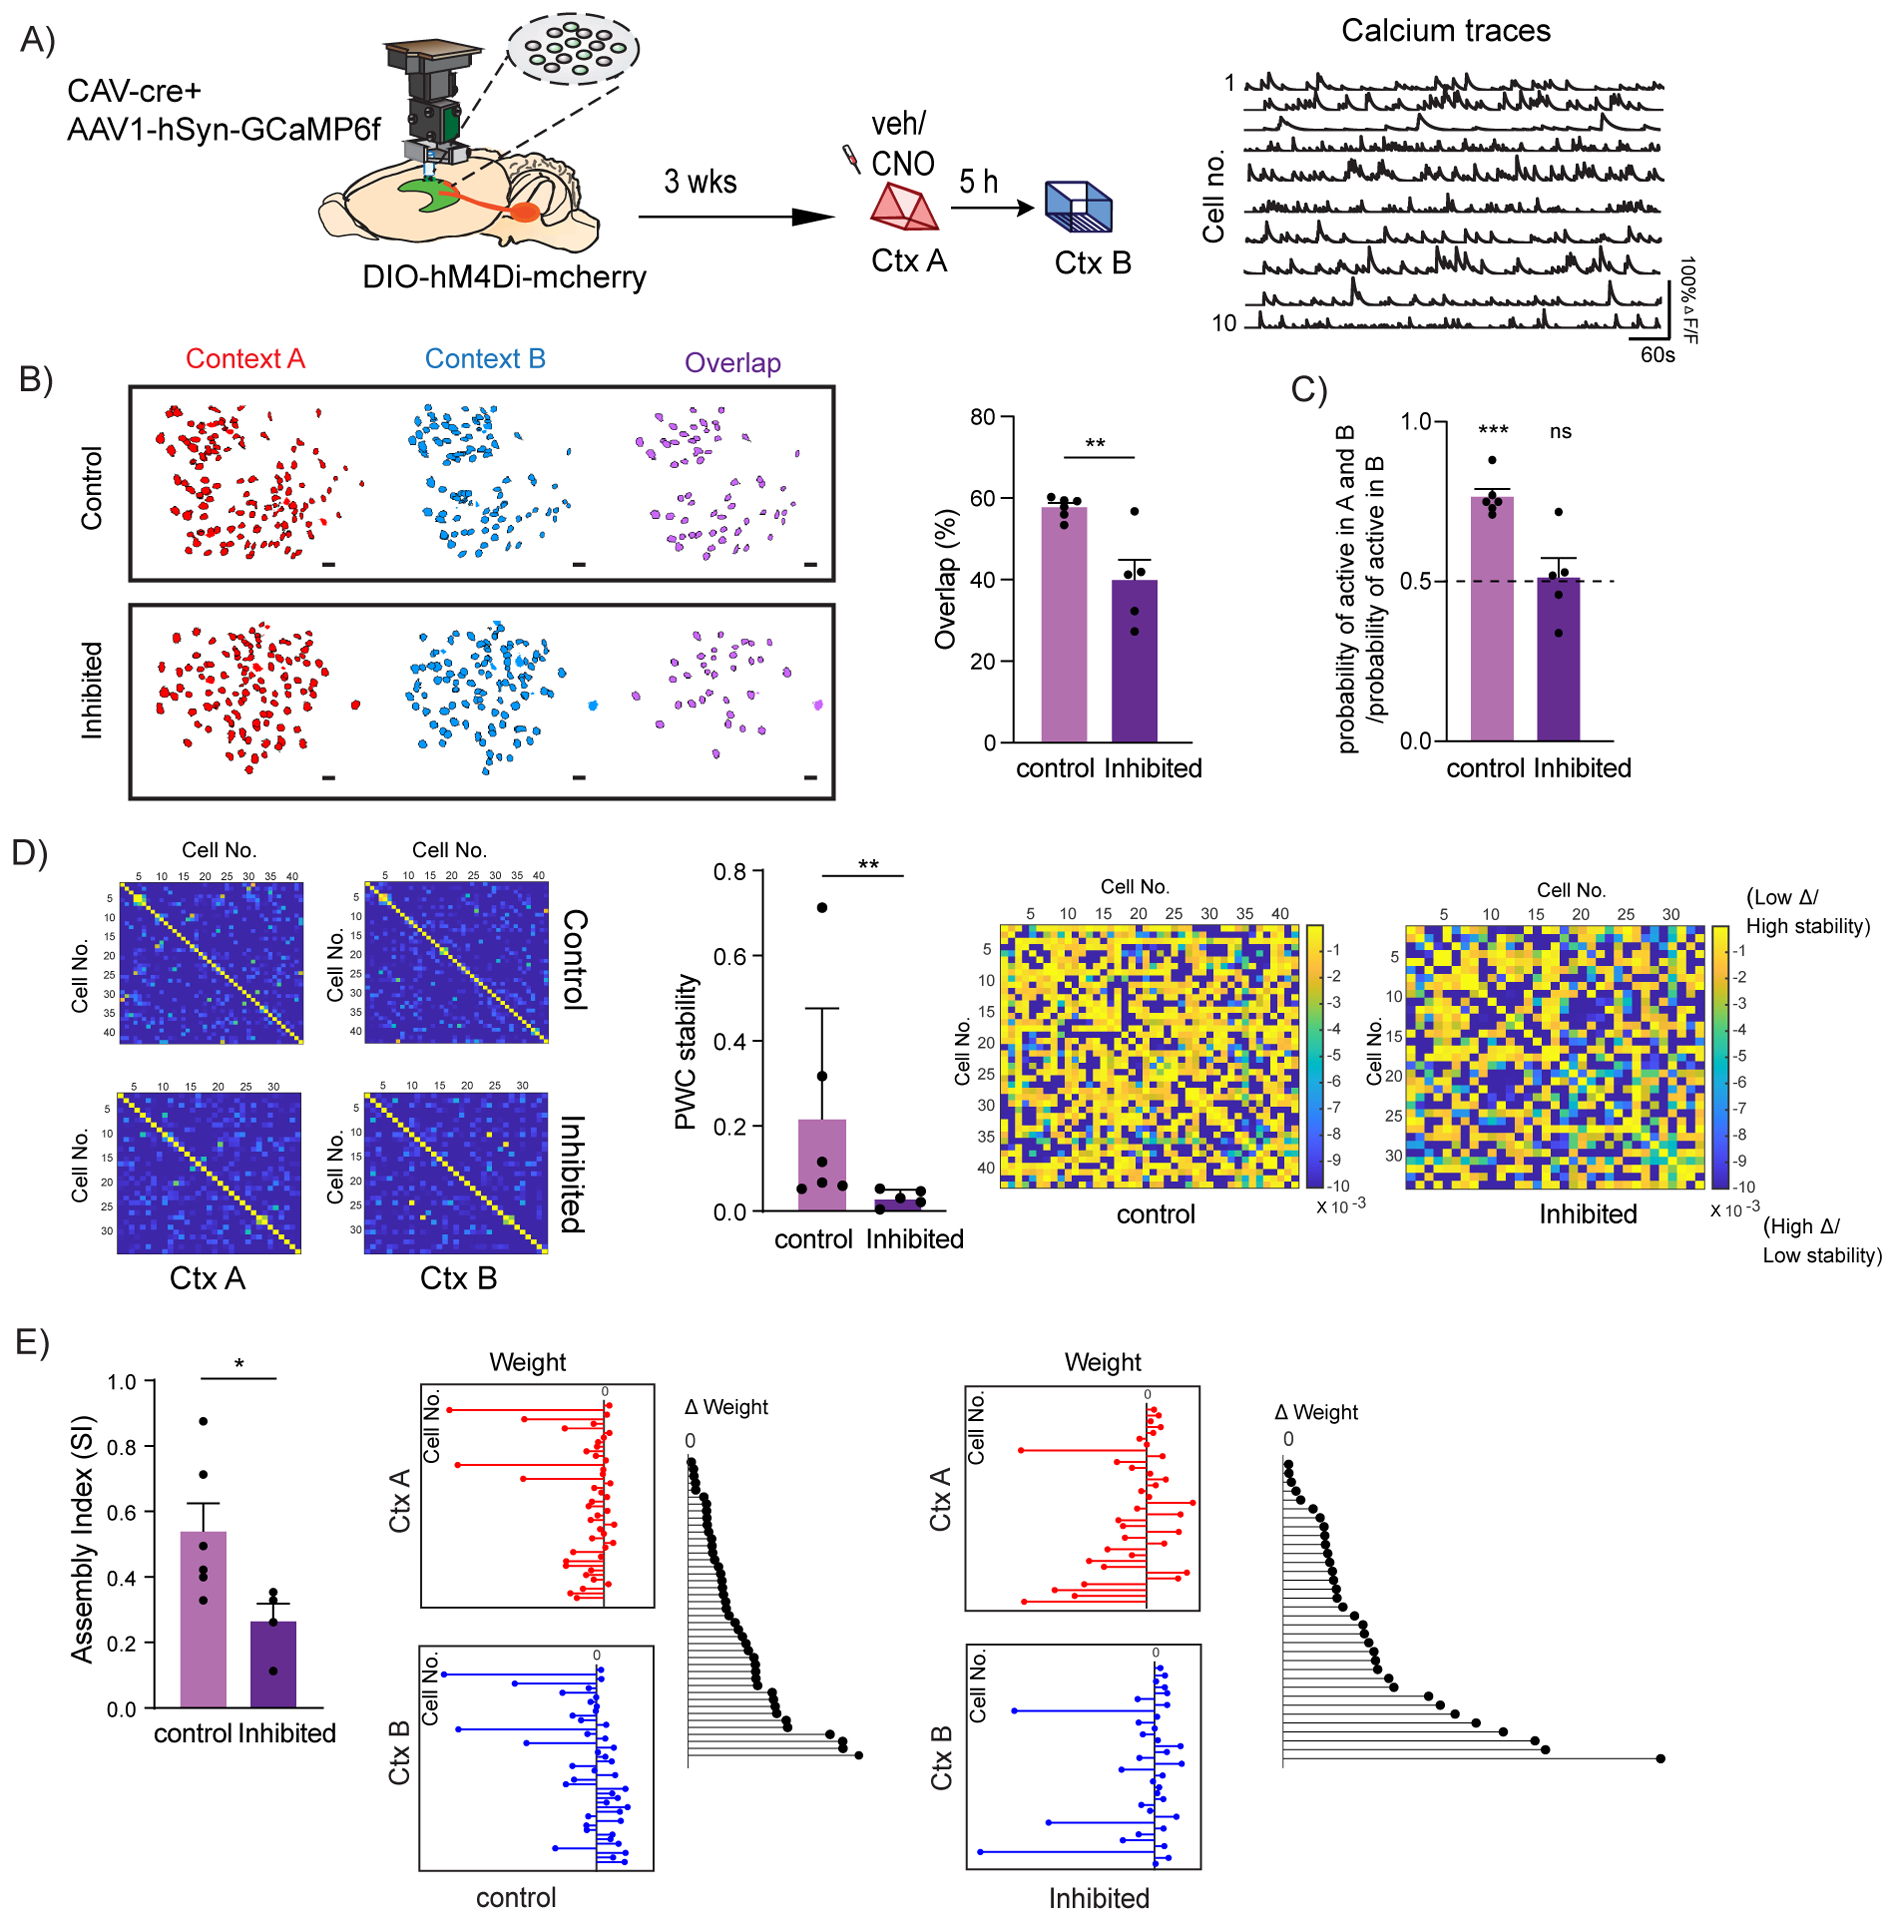
Figure 4: LC to dCA1 inhibition decreases the overlap between dCA1 memory ensembles and affects their firing properties.

(A) Schematics for miniscope setup and calcium signal imaging in dCA1. Example calcium traces.
(B) Inhibition of LC neurons projecting to dCA1 reduced the percentage overlap between memory ensembles encoding contexts explored 5 hours apart (Control n=6, and LC inhibited n=5; unpaired t-test, **p<0.01). Percentage overlap was calculated as neurons active in both A and B over total cells active in A and B. Example plots of active neurons in contexts A and B and neuronal overlap between different conditions. Scale bars, 50μm.
(C) Inhibition of LC neurons projecting to dCA1 reduced the likelihood to chance levels (dashed line) that a cell active in context B had previously been active in context A (Control n=6, and LC inhibited n=5; One-sample t-test over 0.5 as chance level, ***p< 0.001).
(D) Within the overlapping neuronal population, inhibition of the LC neurons projecting to dCA1 reduced the stability of the coactivity maps between the two contexts visited (Control n=6, and LC inhibited n=5; Mann Whitney test, **p<0.01). Example PWC stability maps.
(E) Inhibition of the LC neurons projecting to dCA1 reduced the stability of the dCA1 assemblies detected within the overlapping neuronal population (Control n=6, and LC inhibited n=4; unpaired t-test, *p<0.05). Representative images for weight distribution of the assemblies detected for context A (red), context B (blue), or delta between the two weights (black) with all neurons sorted in the same order in all 3 graphs.
All results are mean + s.e.m.
