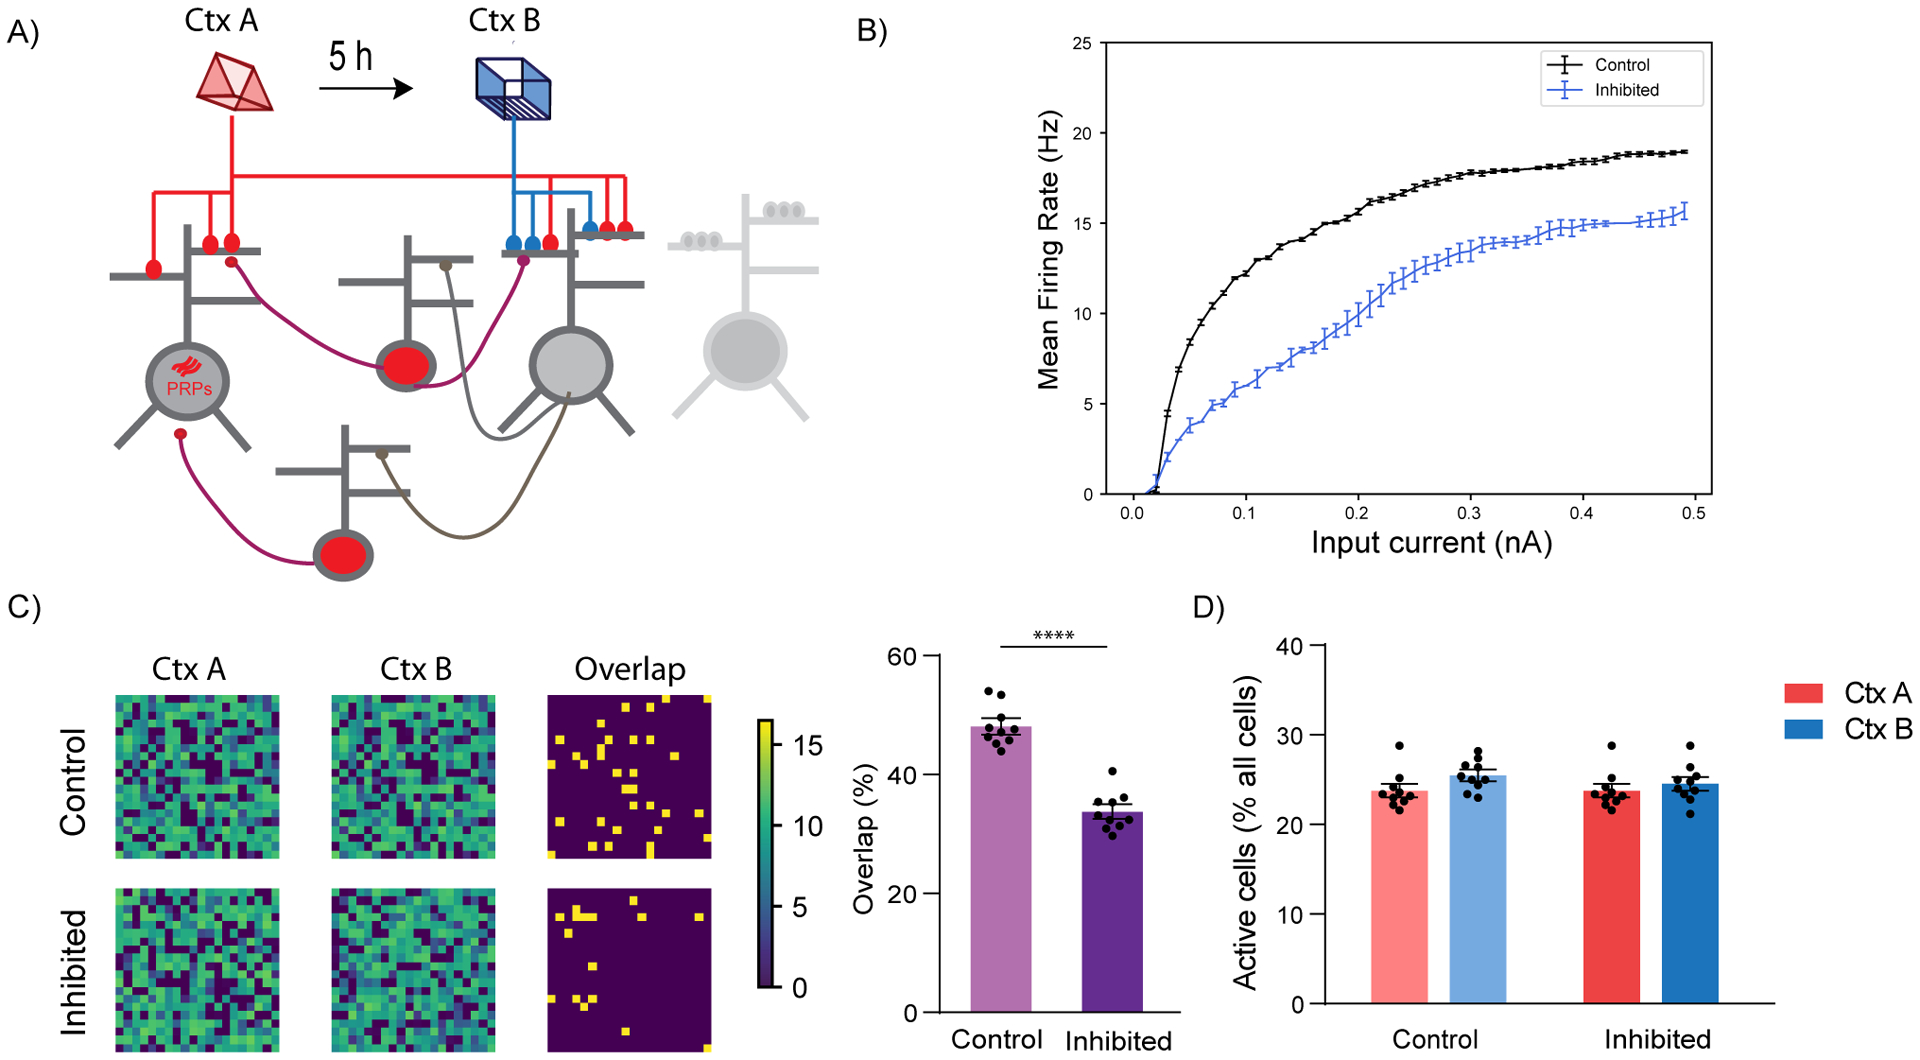
Figure 5: Simulation of LC to dCA1 inhibition using a spiking network model.

(A) Conceptual diagram of the spiking network model. The model includes excitatory neurons (gray) and subpopulations of interneurons (red). Synaptic inputs representing different memories terminate in overlapping dendrites. Two novel contexts are simulated as memories A and B, separated by 5h.
(B) Firing rate of neurons when current input is applied directly to the somatic compartment of the 2-stage neurons under control (blue) and LC inhibition (orange) condition. Under conditions of LC blocking, the excitability of the neurons does not increase, n=50.
(C) Simulation of LC to dCA1 inhibition resulted in a reduction of the overlapping neuronal population. Percentage overlap was calculated as neurons activated during both context A and B over the total active neurons in A and B. n=10 simulation trials, unpaired t-test, ****p<0.0001. The contour plots show population activation during encoding of memories in context A and B. The third column indicates the neurons which were active (ff > 10Hz) during both memories.
(D) The sizes of activated populations (number of neurons with ff>10Hz) during the encoding of Ctx A and Ctx B, under different conditions.
All results are mean + s.e.m.
