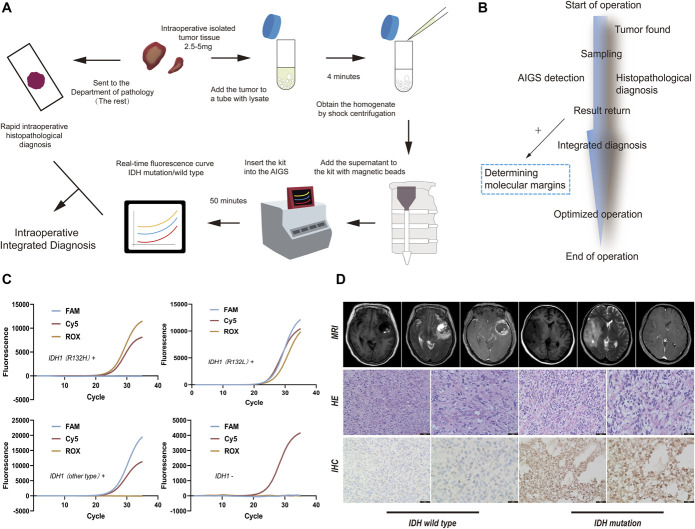
FIGURE 1.
A, AIGS real-time fluorescence PCR detection process and intraoperative integrated diagnostic standard flowchart. B, The time axis of the application of AIGS in surgery. C, The results of various types of AIGS real-time fluorescence PCR detection images. If the FAM curve and ROX curve show S-type amplification (including the S-curve before the platform stage), it indicates that the sample to be tested harbors the IDH1 (R132L) mutation. If only the FAM curve shows S-type amplification, it indicates that there are other types of mutations, such as IDH1 R132C, in the sample to be tested. If only ROX shows an S-type amplification curve, it indicates that the IDH1 (R132H) mutation is present in the tested sample. If only Cy5 shows an S-type amplification curve, it indicates that an IDH1 mutation does not exist in the detected sample. D, MRI images, H&E staining images (The OriGene Company), and IHC images (anti-IDH1, The OriGene Company) of IDH mutation and IDH wild-type gliomas. AIGS, automatic integrated gene detection system; FAM, Carboxyfluorescein; IDH, isocitrate dehydrogenase; IHC, immunohistochemistry; ROX, Rhodamine X.

