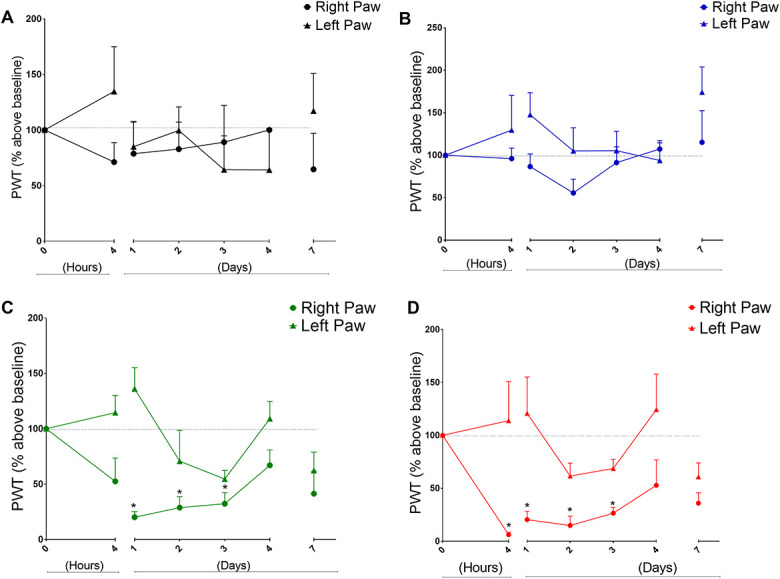
Figure 1.

Time curves of mechanical nociceptive thresholds under different experimental conditions. In all graphs, time 0 represents basal paw withdrawal threshold (PWT). Consecutive measurements of the PWT were performed as indicated by the x-axis. (A) Control group of animals that received 4 consecutive injections of PBS only. (B) After basal PWT measurements, animal received 4 consecutive doses of fentanyl every 15 minutes (60 μg/kg each, 240 μg/kg total). (C) Animals received fentanyl (4 × 60 μg/kg) and underwent surgery in the right hind paw. (D) Animals received PBS (without fentanyl) and underwent surgery. Points represents mean ± SEM (*P < 0.05, ANOVA with repeated measures, N = 5–8 animals per group). ANOVA, analysis of variance.
