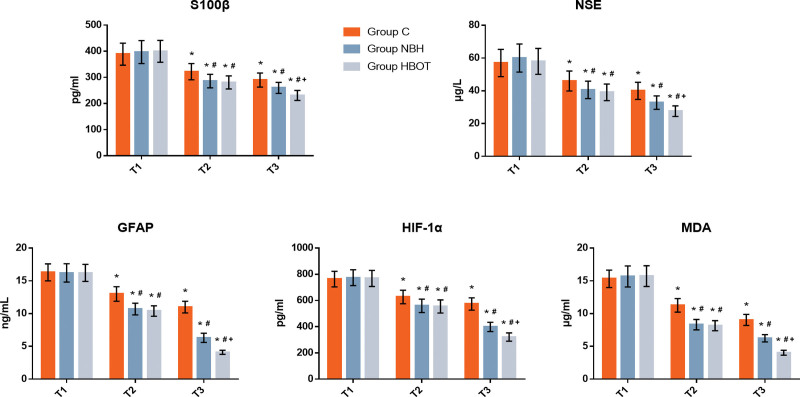
Figure 1.
Concentrations of serum NSE (A), GFAP (B), HIF-1α (C), and MDA (D). Compared with T1, *P < .05; Compared with Group C, #P < .05; Compared with Group NBH, +P < .05. GFAP = glial fibrillary acidic protein, HIF-1α = Hypoxiainducible factor-1α, MDA = malondialdehyde, NBH = normobaric hyperoxia, NSE = neuron-specific enolase.

