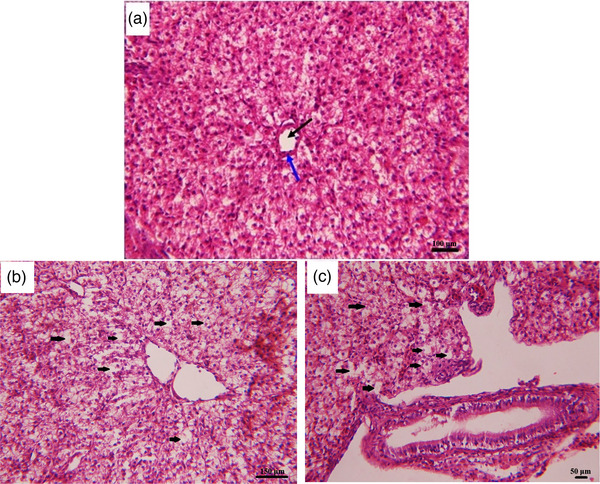
FIGURE 4.

Histological structure of liver of common carp showing histopathological alterations due to 28 days meloxicam exposure at different concentrations. (A) Liver section of control fish shows normal construction of portal vein (black arrow) restricted by pancreatic tissue (blue arrow); (B) liver section of fish exposed to medium dose (1 mg L−1) of the meloxicam shows the increased vacuolation in hepatocytes (black arrows); (C) liver section of fish exposed to high dose (2 mg L−1) of the meloxicam, shows the increased vacuolisation in hepatocytes (black arrows); stain: H & E; 400× magnification.
