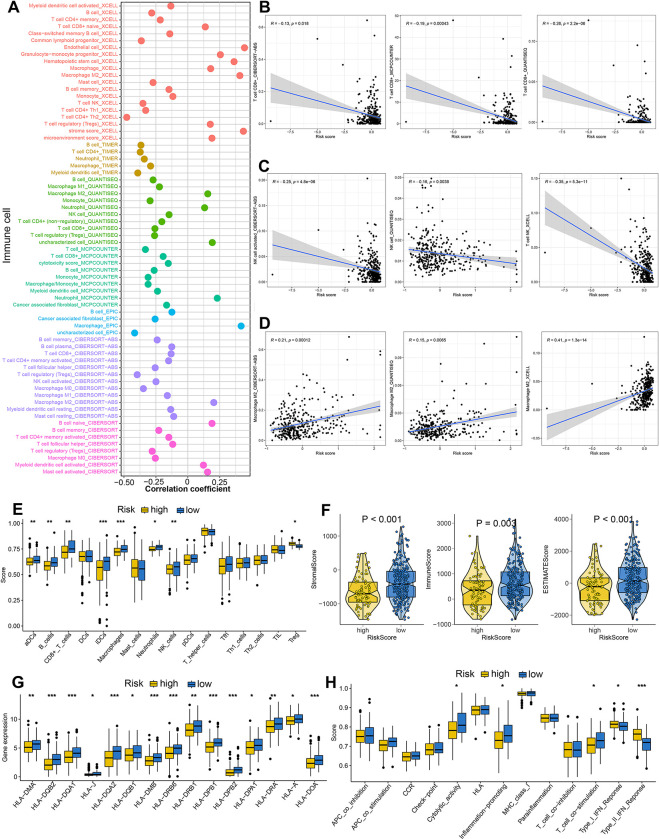
Fig 6. Immune microenvironment landscape in HCC patients with different risk score.
(A) The correlation between risk score and the immune cell infiltration based on several state-of-the-art algorithms. Risk score showed negative correlation with the abundance of CD8+ T cells (B), NK cells (C) and positive correlation with the abundance of M2-like macrophage (D). (E) The level of immune cells in HCC patients with different risk score based on ssGSEA analysis. (F) Low risk score indicated a higher stromal score, immune score, and ESTIMAE score. (G-H) The score of HLA-related genes and immune-related functions in HCC patients with different risk score. *p<0.05, **p<0.01, ***p<0.001.

