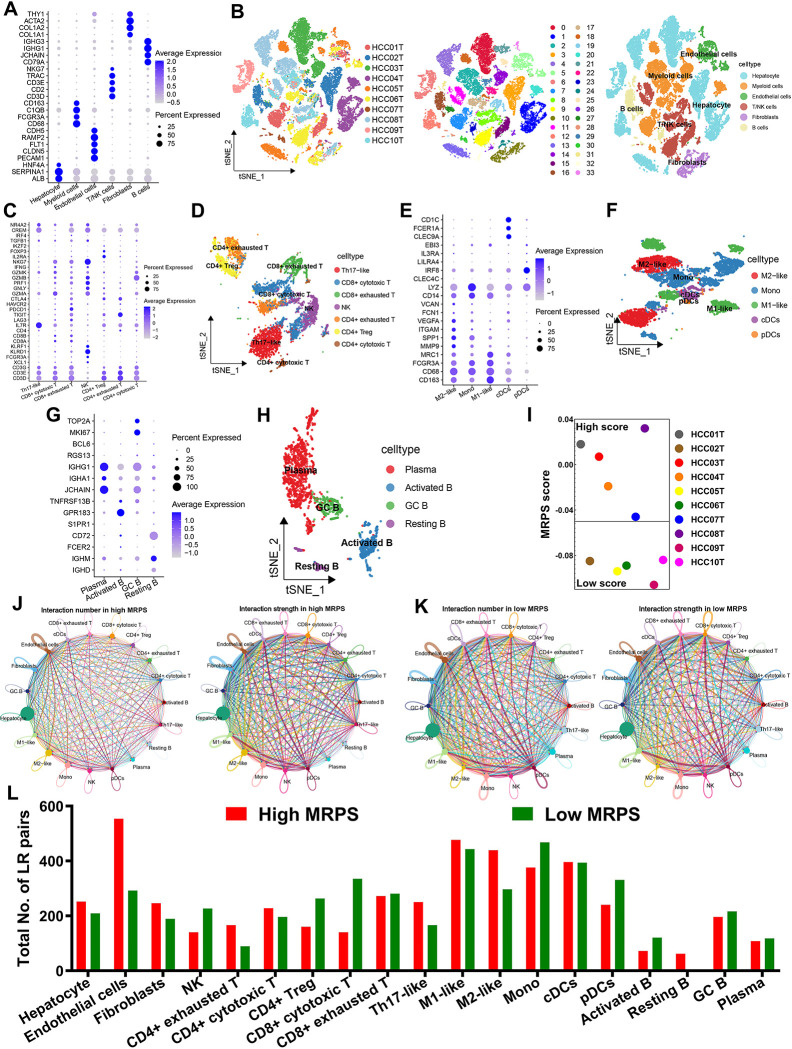
Fig 7. The distinct ecosystem in HCC patients with different MRPS score based on single cell analysis.
(A) Dotplot showing the percentage of expressed cells and average expression levels of cell marker genes of major cell types. (B) T-distributed Stochastic Neighbor Embedding plot of 34 cell clusters and 6 major cell types from 10 HCC samples. (C-D) Based on expression pattern of cell markers, T/NK cells could be re-clustered into 7 cell types. (E-F) Myeloid cells could be clustered into M1-like macrophages, M2-like macrophages, monocyte (mono), plasmacytoid DCs (pDCs), and conventional dendritic cells (cDCs) according to the expression pattern of cell markers. (G-H) B cells were subdivided into plasma, GC B, resting B, and activated B according to the expression pattern of cell markers. (I) the MRPS score of 10 HCC patients. (J-K) CellChat revealing cell–cell communication network via known ligand-receptor pairs in HCC samples with different MRPS score. (L) Low MRPS-derived NK, CD8+ cytotoxic T, activated B possessed a higher number of ligand-receptor pairs, whereas the CD4+ exhauster T, Th17-like and M2-like macrophage possessed fewer pairs.

