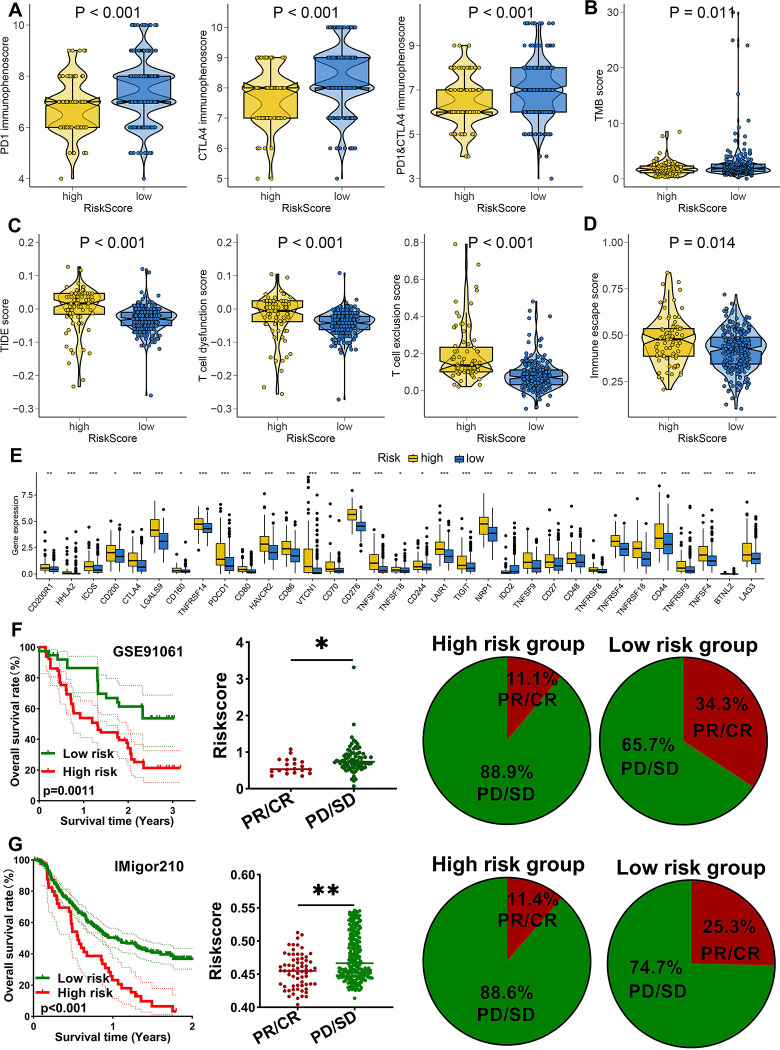
Fig 8. M2-like macrophages-related prognostic signature as an indicator for immunotherapy response in HCC.
(A-B) The immunophenoscore and TMB score in HCC patients with high and low risk score. (C-D) The TIDE, T cell dysfunction score, T cell exclusion score and immune escape score in HCC patients with high and low risk score. (E) The level of common immune checkpoints in HCC patients with high and low risk score. The overall rate and immunotherapy response rate in patients with high and low risk score in GSE91061 (F) and IMvigor210 (G) cohort. *p<0.05, **p<0.01, ***p<0.001.

