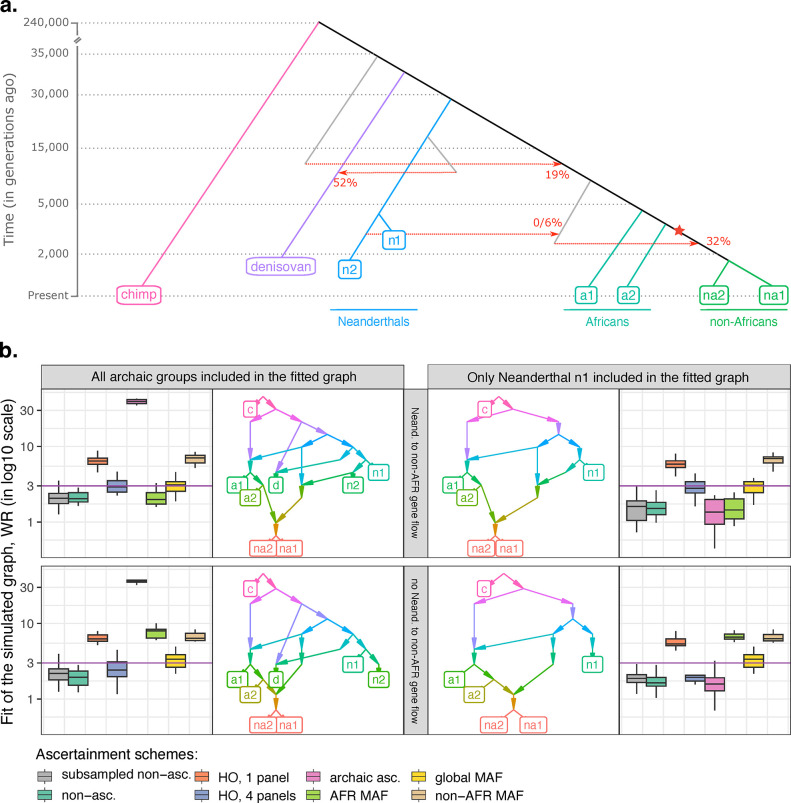
Fig 3. Exploring the influence of non-outgroup ascertainment on fits of admixture graphs in the case of a single simulated history reproducing some known features of the genetic history of anatomically modern and archaic humans (but differing in other respects from the widely accepted model [53]).
Results are presented for two topologies (with or without the Neanderthal to non-African gene flow simulated) and for eight types of SNP sets: 1) 10 sets of randomly selected variable sites matching the average size of the “HO one-panel” set, 500K sites (abbreviated as “subsampled non-asc.”); 2) unascertained sites (on average 5.55M polymorphic sites without missing data at the group level); 3) HO one-panel ascertainment based on the “African 2” group (500K sites on average across simulation iterations); 4) HO four-panel ascertainment, based on randomly selected individuals from four groups (“African 1”, “African 2”, “non-African 1”, and “non-African 2”, 1.34M sites on average); 5) archaic ascertainment (1.05M sites on average); 6) “AFR MAF”, that is restricting to sites with MAF >5% in the union of the “African 1” and “African 2” groups (1.85M sites on average); 7) global MAF ascertainment on the union of the “African 1”, “African 2”, “non-African 1”, and “non-African 2” groups (1.62M sites on average); 8) non-African MAF ascertainment on the union of the “non-African 1” and “non-African 2” groups (1.48M sites on average). (a) The simulated topology, with dates (in generations) shown on the y-axis (for the sake of visual clarity, the axis is not to scale). The Neanderthal to non-African gene flow was simulated either at 0% or at ~2% as shown in the figure. Effective population sizes and population split times are omitted for clarity (see S13 Table). The out-of-Africa bottleneck is marked with a star. (b) Boxplots illustrating the effects of various ascertainment schemes on fits (worst f4-statistic residuals, WR) of the correct admixture graphs. The dashed line on the logarithmic scale marks a WR threshold often used in the literature for classifying models into fitting and non-fitting ones, 3 standard errors. The observation that common ascertainment schemes consistently produce much higher Z-scores than this threshold provides unambiguous evidence that ascertainment bias can profoundly compromise admixture graph fitting. The topologies fitted to the data are shown beside the boxplots. In the panels on the right, simple graphs including only one archaic lineage are fitted (with “Neanderthal 1” used as an example, but very similar results were obtained for the “Neanderthal 2” and “Denisovan” groups). In the panels on the left, results for the full simulated model fitted to the data are shown.

