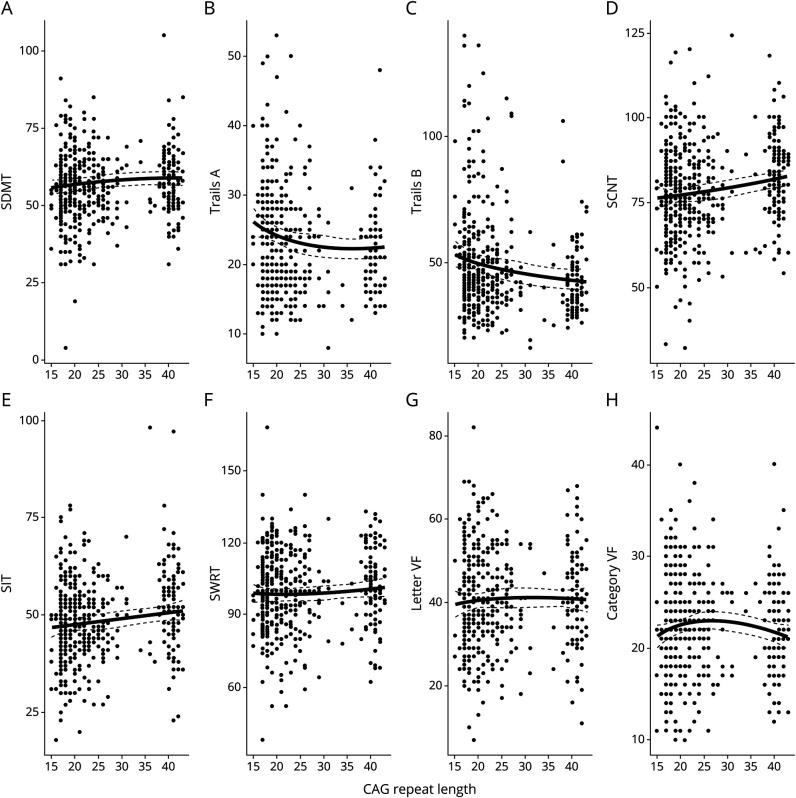
Figure 2. CAG Relationship With Cognitive Tests.
Thick black regression lines represent the nonlinear relationship across all CAG repeat lengths and the cognitive tasks. This line was produced from the individual models described. Dashed lines represent the 95% confidence interval of those models. For panels A–H, the y-axis represents the total correct of the listed cognitive tasks. Category VF = Category Verbal Fluency Task; Letter VF = Letter Verbal Fluency Task; SCNT = Stroop Color Naming Test; SDMT = Symbol Digit Modalities Test; SIT = Stroop Interference Test; SWRT = Stroop Word Reading Test; Trails A = Part A of the Trail Making Test; Trails B = Part B of the Trail Making Test.

