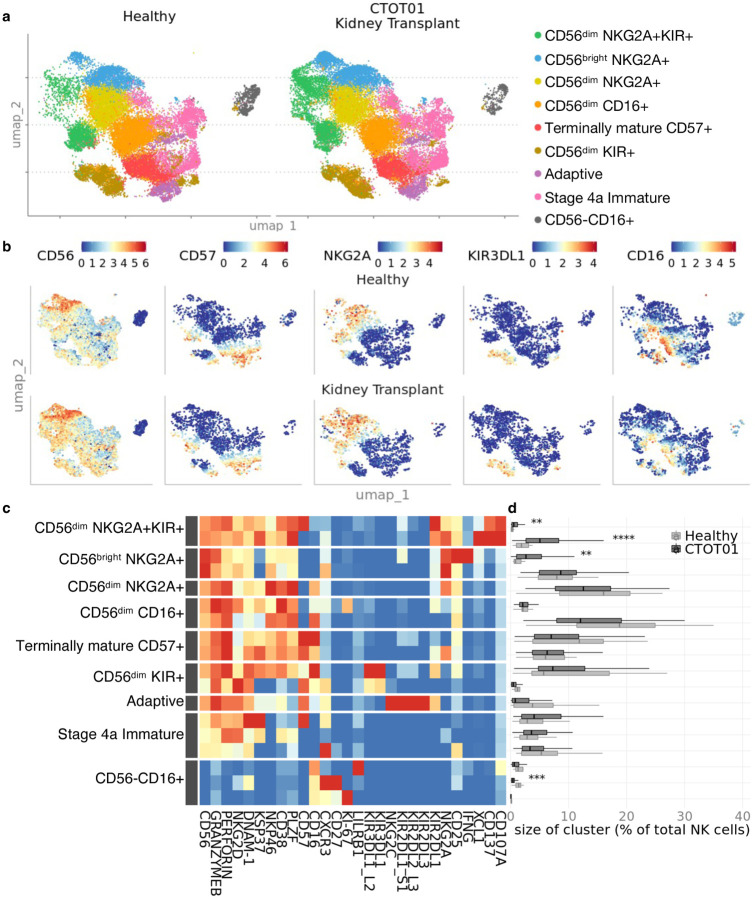
Fig. 1. NK cells vary in phenotype and composition across healthy donors and kidney transplant recipients.
Cyropreserved PBMC from healthy donor (n=20) and CTOT01 kidney transplant recipients (n=70) were recovered overnight in RPMI medium supplemented with 10 ng/mL recombinant human (rh) IL-15 and 10% heat-inactivated FBS. Results were profiled by CyTOF. a U-MAP of unsupervised RPhenograph clustering of peripheral blood derived NK cells shows heterogenous populations defined by variable expression of b NK cell markers CD56, CD57, CD16 and activating/inhibitory receptors such as NKG2A and KIR3DL1. c Heatmap shows median expression of CyTOF antibodies defining NK cell clusters. d Relative proportions of NK cell clusters across healthy donors and CTOT01 recipients were calculated by dividing number of cells in cluster by total NK cells per subject. P value was calculated using 2-sided unpaired Student’s t-test and values were adjusted for multiple testing with Bonferroni correction; **p < 0.01, ***p < 0.001, ****p < 0.0001.

