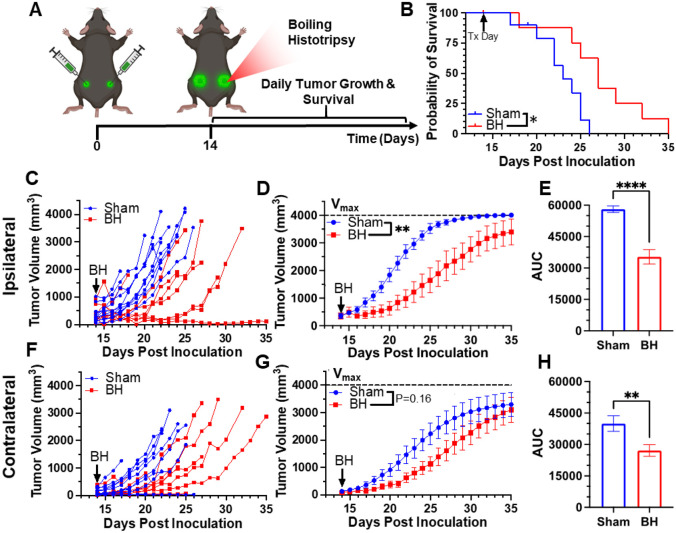
Figure 1. BH yields primary and abscopal control of B16F10-ZsG melanoma.
4x10⁵ B16F10-ZsG cells were inoculated in the left and right flanks of C57/Bl6 mice and tumors were exposed to BH or sham treatment 14 days post inoculation. A. Timeline for inoculation and treatment. B. Kaplan-Meier curve depicting overall survival (significance assessed by log-rank (Mantel-Cox) test: ∗ P<0.05). C-H. Ipsilateral and contralateral tumor growth. C & F. Individual tumor growth curves. D & G. Average logistic modeled tumor growth. n=8-11 per group. Full model, two-way repeated measures ANOVA from day 14 to 35, fixed effects: ** P<0.01. E & H. Area under the logistic average curve (AUC). Unpaired Welch’s t-test: ** p < 0.01, **** p < 0.0001. Means ± SEM.

