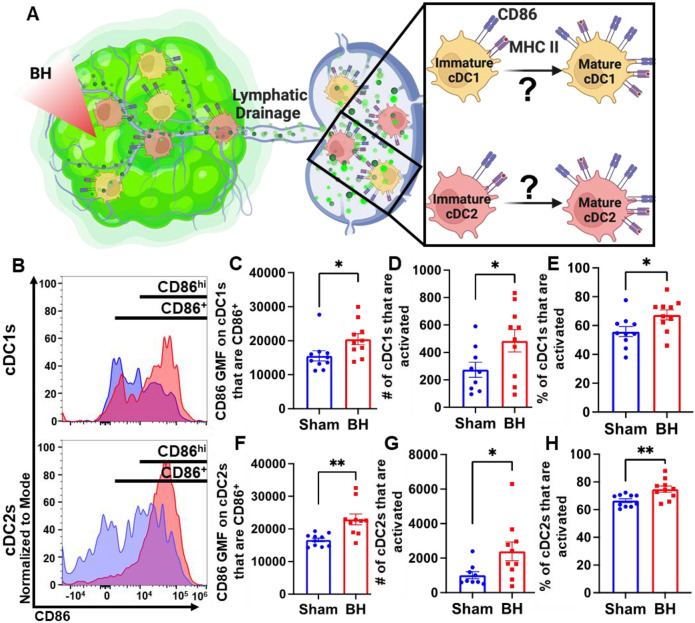
Figure 5. BH activates cDCs in tumor draining lymph nodes.
A. Diagram illustrating the question of whether BH activates cDC1s and cDC2s. B. Frequency plots of side scatter vs CD86 for cDC1s (top) and cDC2s (bottom). C & F. Bar graphs of CD86 GMF of CD86+ cDC subsets. D & G. Bar graphs of number of activated cDCs (CD86hiMHCIIhi). E & H. Bar graphs of percent of cDCs that are activated (CD86hiMHCIIhi). n=10 per group. Unpaired Welch’s t-test: * p < 0.05, ** p < 0.01. Means ± SEM.

