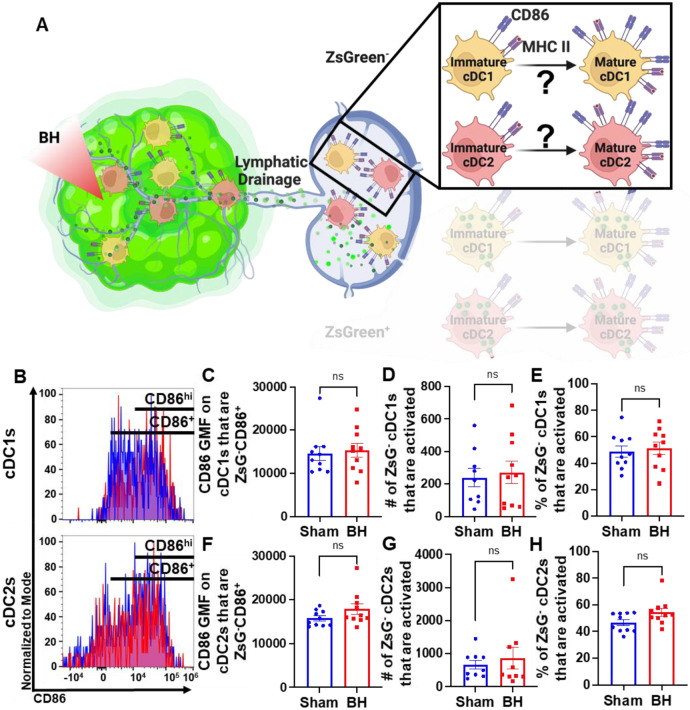
Figure 6. BH-induced cDC depends on ZsG acquisition.
A. Diagram illustrating the overall question of whether ZsG acquisition is required for cDC1 and/or cDC2 activation. Data in this figure interrogate ZsG− cDCs, so the ZsG+ portion is shaded. B. Frequency plots of side scatter vs CD86 for ZsG− cDC1s (top) and ZsG− cDC2s (bottom). C & F. Bar graphs of geometric mean fluorescence (GMF) intensity of CD86 on CD86+ZsG− cDC subsets D & G. Bar graphs of number of specified ZsG− cDC subset that are activated (CD86hiMHCIIhi). E & H. Bar graphs of percent of specified cDC subset that are activated (CD86hiMHCIIhi). n=10 per group. Unpaired Welch’s t-test: not significant. Means ± SEM.

