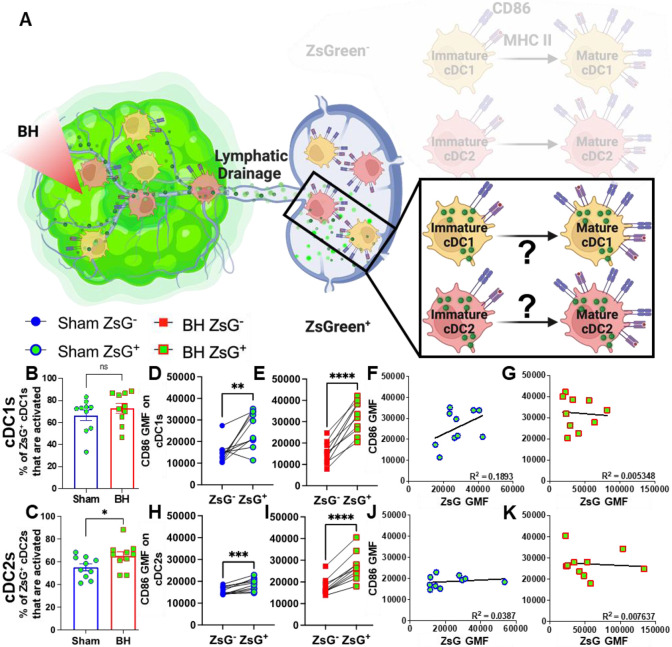
Figure 7. ZsG antigen promotes cDC maturation.
A. Diagram illustrating the overall question of whether ZsG acquisition is required for cDC1 and/or cDC2 activation. Data in this figure interrogate ZsG+ cDCs, so the ZsG− portion is shaded. B & C. Bar graphs of percent of ZsG+ cDC1s (B) and cDC2s (C) that are activated (CD86hiMHCIIhi). n=10 per group. Unpaired Welch’s t-test: * p < 0.05. D-E & H-I. Geometric mean fluorescent (GMF) intensity of CD86 on ZsG− and ZsG+ cDC1s (D-E) and cDC2s (H-I). n = 10. Paired t-test: * p < 0.05, ** p < 0.01, *** p < 0.001, **** p < 0.0001. F & J. CD86 expression as a function of ZsG expression in ZsG+ cDC1s (F) and ZsG+ cDC2s (J) after sham treatment. G & K. CD86 expression as a function of ZsG expression in ZsG+ cDC1s (G) and ZsG+ cDC2s (K) after BH. Correlations are by linear regression with displayed R2 values.

