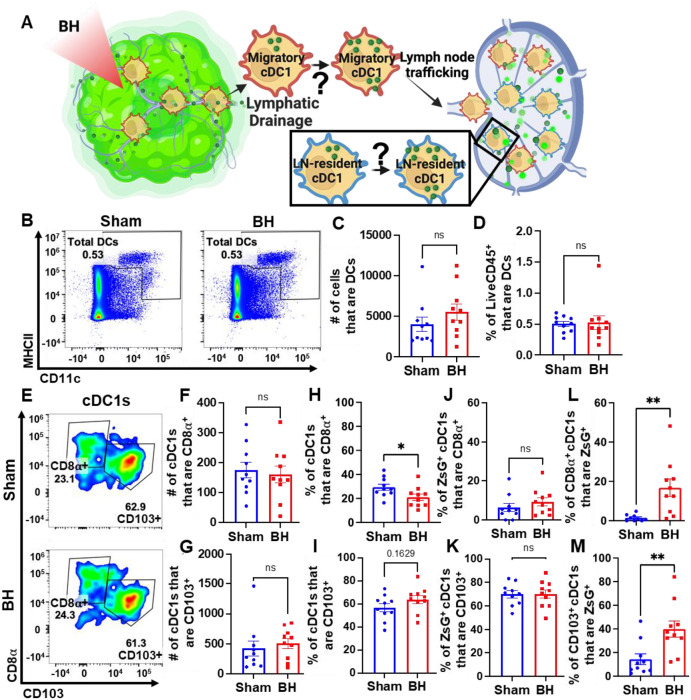
Figure 8. BH changes neither total DCs nor the proportions of ZsG+ cDC1s that are LN-resident (CD8α+) and migratory (CD103+).
A. Diagram illustrating the question of whether cDC1s acquire BH-liberated ZsG in tumor and/or TDLN. B. Density scatter plots of CD11c vs MHCII with DCs (CD11c+MHCII+) in sham and BH treated TDLNs. C. Number of total DCs. D. Percentage of LiveCD45+ cells that are DCs. E. Density scatter plots of CD8α vs. CD103 to identify tissue-resident (CD8α+CD103−) and migratory (CD103+) cDC1s in TDLNs of sham and BH treated mice. F & G. Number of tissue-resident (F) and migratory (G) cDC1s. H & I. Percentage of cDC1s that are tissue-resident (H) and migratory (I). J & K. Percentage of ZsG+ cDC1s that are tissue-resident (J) and migratory (K). L & M. Proportion of tissue-resident (L) and migratory (M) cDC1s that are ZsG+. n=10. Unpaired Welch’s t-test: * p < 0.05, ** p < 0.01. Means ± SEM.

