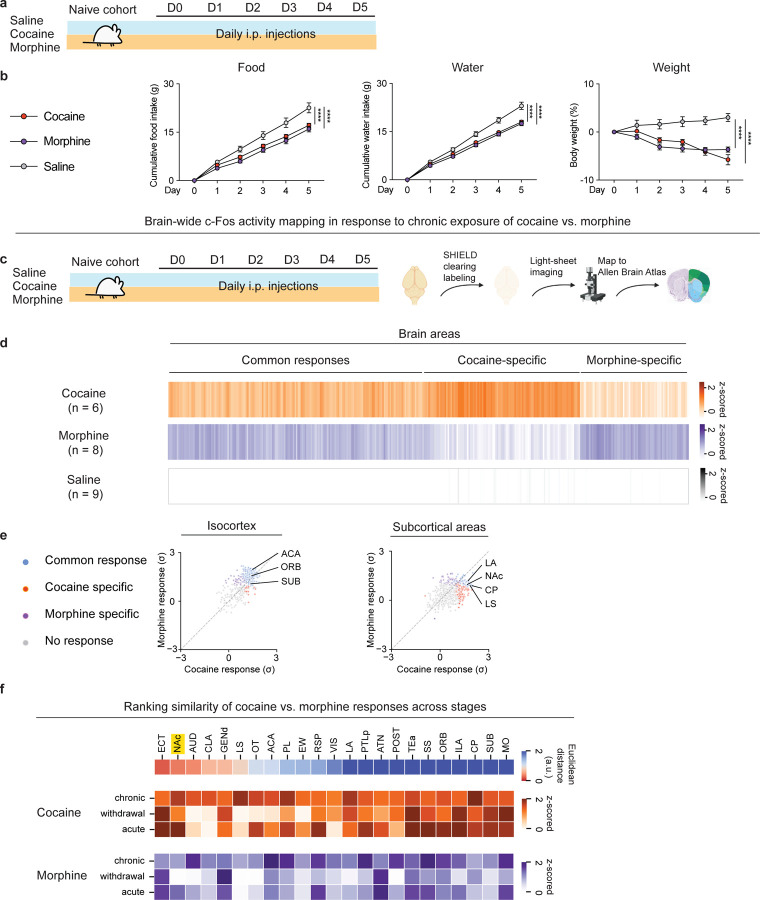
Figure. 1. Whole-brain FOS mapping identifies shared regulation of NAc by chronic exposure to cocaine vs. morphine.
(a), Schematic of the experimental design for repeated exposure of drug rewards vs. saline. Three cohorts of mice received 20 mg/kg cocaine, 10 mg/kg morphine, saline, respectively via i.p. injections for 5 days. All cohorts had adlibitum access to food and water. Comparisons of (b), Cumulative food intake (g), Cumulative water intake (g), Weight (%) over the 5-day treatment (n = 10, 10, 10 for saline, cocaine, morphine group, respectively, two-way ANOVA with Dunnett’s multiple comparisons). (c), Schematic of the experiment design for chronic exposure of drug rewards vs. saline followed by whole-brain clearing and mapping to Allen Brain Atlas. Three cohorts of mice received saline, 20 mg/kg cocaine, 10 mg/kg morphine, respectively (n = 9, 6, 8 for each group) via i.p. injections for 5 days. (d), Heatmap overview of brain areas showing significant FOS activity across three groups (One-way ANOVA for each brain area with cut-off p < 0.05 classified as statistically significant, followed by K-means clustering). (e), Scatter plot of FOS activity of cortical areas in response to cocaine vs. morphine (left). Scatter plot of FOS activity of subcortical areas in response to cocaine vs. morphine (right). Common response: areas showed significant changes (P < 0.05) of FOS+ counts in cocaine and morphine groups compared to the saline group; Cocaine or Morphine specific: areas only showed significant changes of FOS+ counts in either the cocaine or morphine group compared to the saline group. (f), Similarity of FOS responses across different phases of exposure to cocaine vs. morphine (top). Heatmap representations of brain areas after acute and chronic exposure to cocaine or morphine and after spontaneous withdrawal (bottom). All error bars represent mean ± s.e.m. NS, not significant, *P < 0.05, **P < 0.01, ***P < 0.001, ****P < 0.0001.

