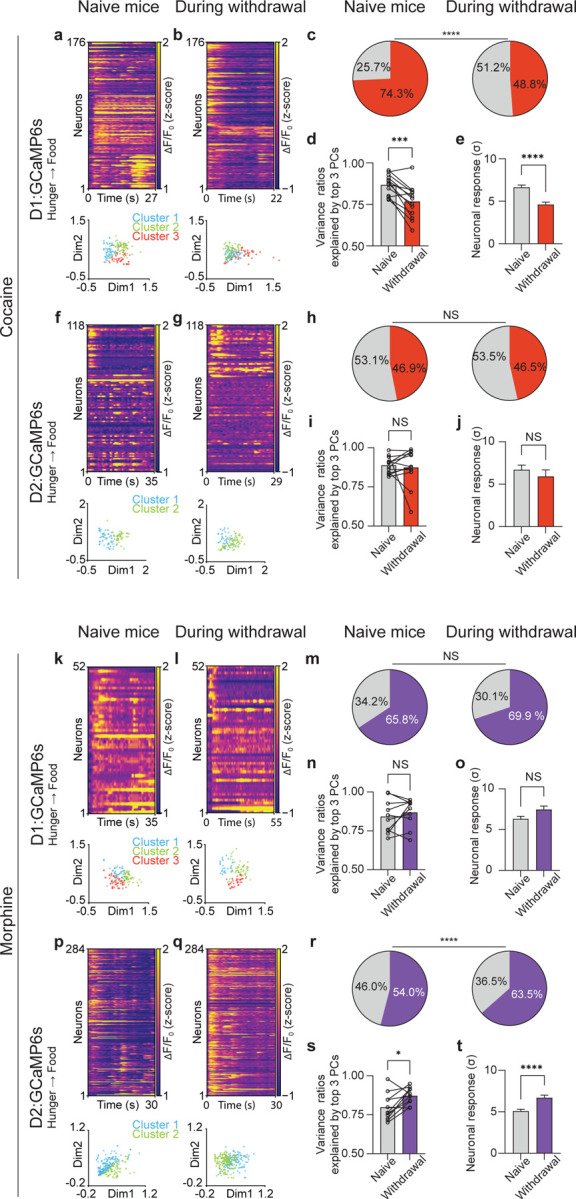
Figure. 4. Preferential, cell-type-specific alteration of cocaine- or morphine-induced neuronal responses to natural reward.

(a), Top: Representative heatmap of D1 neuronal responses during food consumption from an example mouse before exposure to cocaine (n = 176 matched neurons). Bottom: non-negative matrix factorization (NMF) representation of neuronal states labeled by clusters. (b), Top: Representative heatmap of D1 neuronal responses during food consumption from an example mouse during acute withdrawal of cocaine (n = 176 matched neurons). Bottom: NMF representation of neuronal states labeled by k-means clusters. (c), Percentage of D1 neurons activated by food and water consumption in the same mice before and after cocaine exposure (n = 914 matched neurons combined from 13 matched sessions from 3 mice, Fisher’s exact test). (d), Variances explained by top 3 principal components (PCs) during food and water consumption in the same mice before and after cocaine exposure (n = 13 matched sessions from 3 mice). (e), Matched D1 neuronal responses in the same mice before and after cocaine exposure (n = 914 matched neurons, two-tailed Wilcoxon test). (f), Top: Representative heatmap of D2 neuronal responses during food consumption from an example mouse before exposure to cocaine (n = 118 matched neurons). Bottom: NMF representation of neuronal states labeled by clusters. (g), Top: Representative heatmap of D2 neuronal responses during food consumption from an example mouse during acute withdrawal of cocaine (n = 118 matched neurons). Bottom: NMF representation of neuronal states labeled by clusters. (h), Percentage of D2 neurons activated by food and water consumption in the same mice before and after cocaine exposure (n = 488 matched neurons combined from 12 sessions from 3 mice, Fisher’s exact test). (i), Variances explained by top 3 PCs during food and water consumption in the same mice before and after cocaine exposure (n = 12 matched sessions from 3 mice). (j), Matched D2 neuronal responses in the same mice before and after cocaine exposure (n = 488 matched neurons, two-tailed Wilcoxon test). (k), Top: Representative heatmap of D1 neuronal responses during food consumption from an example mouse before exposure to morphine (n = 52 matched neurons). Bottom: NMF representation of neuronal states labeled by clusters. (l), Top: Representative heatmap of D1 neuronal responses during food consumption from an example mouse during acute withdrawal of morphine (n = 52 matched neurons). Bottom: NMF representation of neuronal states labeled by clusters. (m), Percentage of D1 neurons activated by food and water consumption in the same mice before and after morphine exposure (n = 587 matched neurons combined from 10 sessions from 3 mice, Fisher’s exact test). (n), Variances explained by top 3 PCs during food and water consumption in the same mice before and after morphine exposure (n = 10 matched sessions from 3 mice). (o), Matched D1 neuronal responses in the same mice before and after morphine exposure (n = 587 matched neurons, two-tailed Wilcoxon test). (p), Top: Representative heatmap of D2 neuronal responses during food consumption from an example mouse before exposure to morphine (n = 284 matched neurons). Bottom: NMF representation of neuronal states labeled by clusters. (q), Top: Representative heatmap of D2 neuronal responses during food consumption from an example mouse during acute withdrawal of morphine (n = 284 matched neurons). Bottom: NMF representation of neuronal states labeled by cluster. (r), Percentage of D2 neurons activated by food and water consumption in the same mice before and after morphine exposure (n = 1174 matched neurons combined from 11 sessions from 3 mice, Fisher’s exact test). (s), Variances explained by top 3 PCs during food and water consumption in the same mice before and after morphine exposure (n = 11 matched sessions from 3 mice). (t), Matched D2 neuronal responses in the same mice before and after morphine exposure (n = 1174 matched neurons, two-tailed Wilcoxon test). All error bars represent mean ± s.e.m. NS, not significant, *P < 0.05, **P < 0.01, ***P < 0.001, ****P < 0.0001.
