
FIGURE 2.
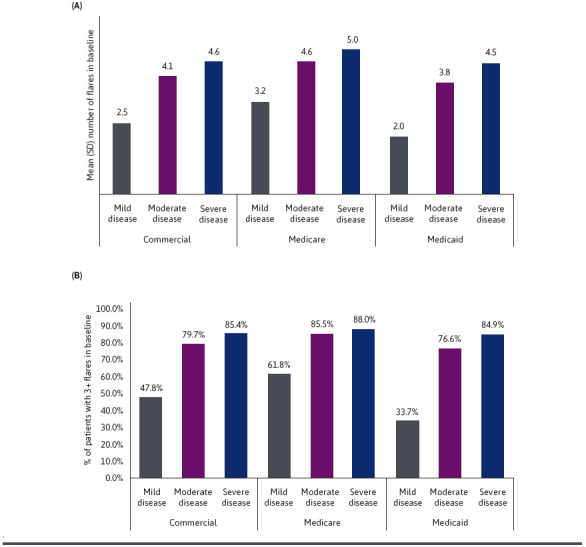
(A) Number of Flares in Baseline Year by Disease Severity and (B) Proportion of Patients With 3+ Flares in Baseline Year by Disease Severity
Official websites use .gov
A
.gov website belongs to an official
government organization in the United States.
Secure .gov websites use HTTPS
A lock (
) or https:// means you've safely
connected to the .gov website. Share sensitive
information only on official, secure websites.
(A) Number of Flares in Baseline Year by Disease Severity and (B) Proportion of Patients With 3+ Flares in Baseline Year by Disease Severity