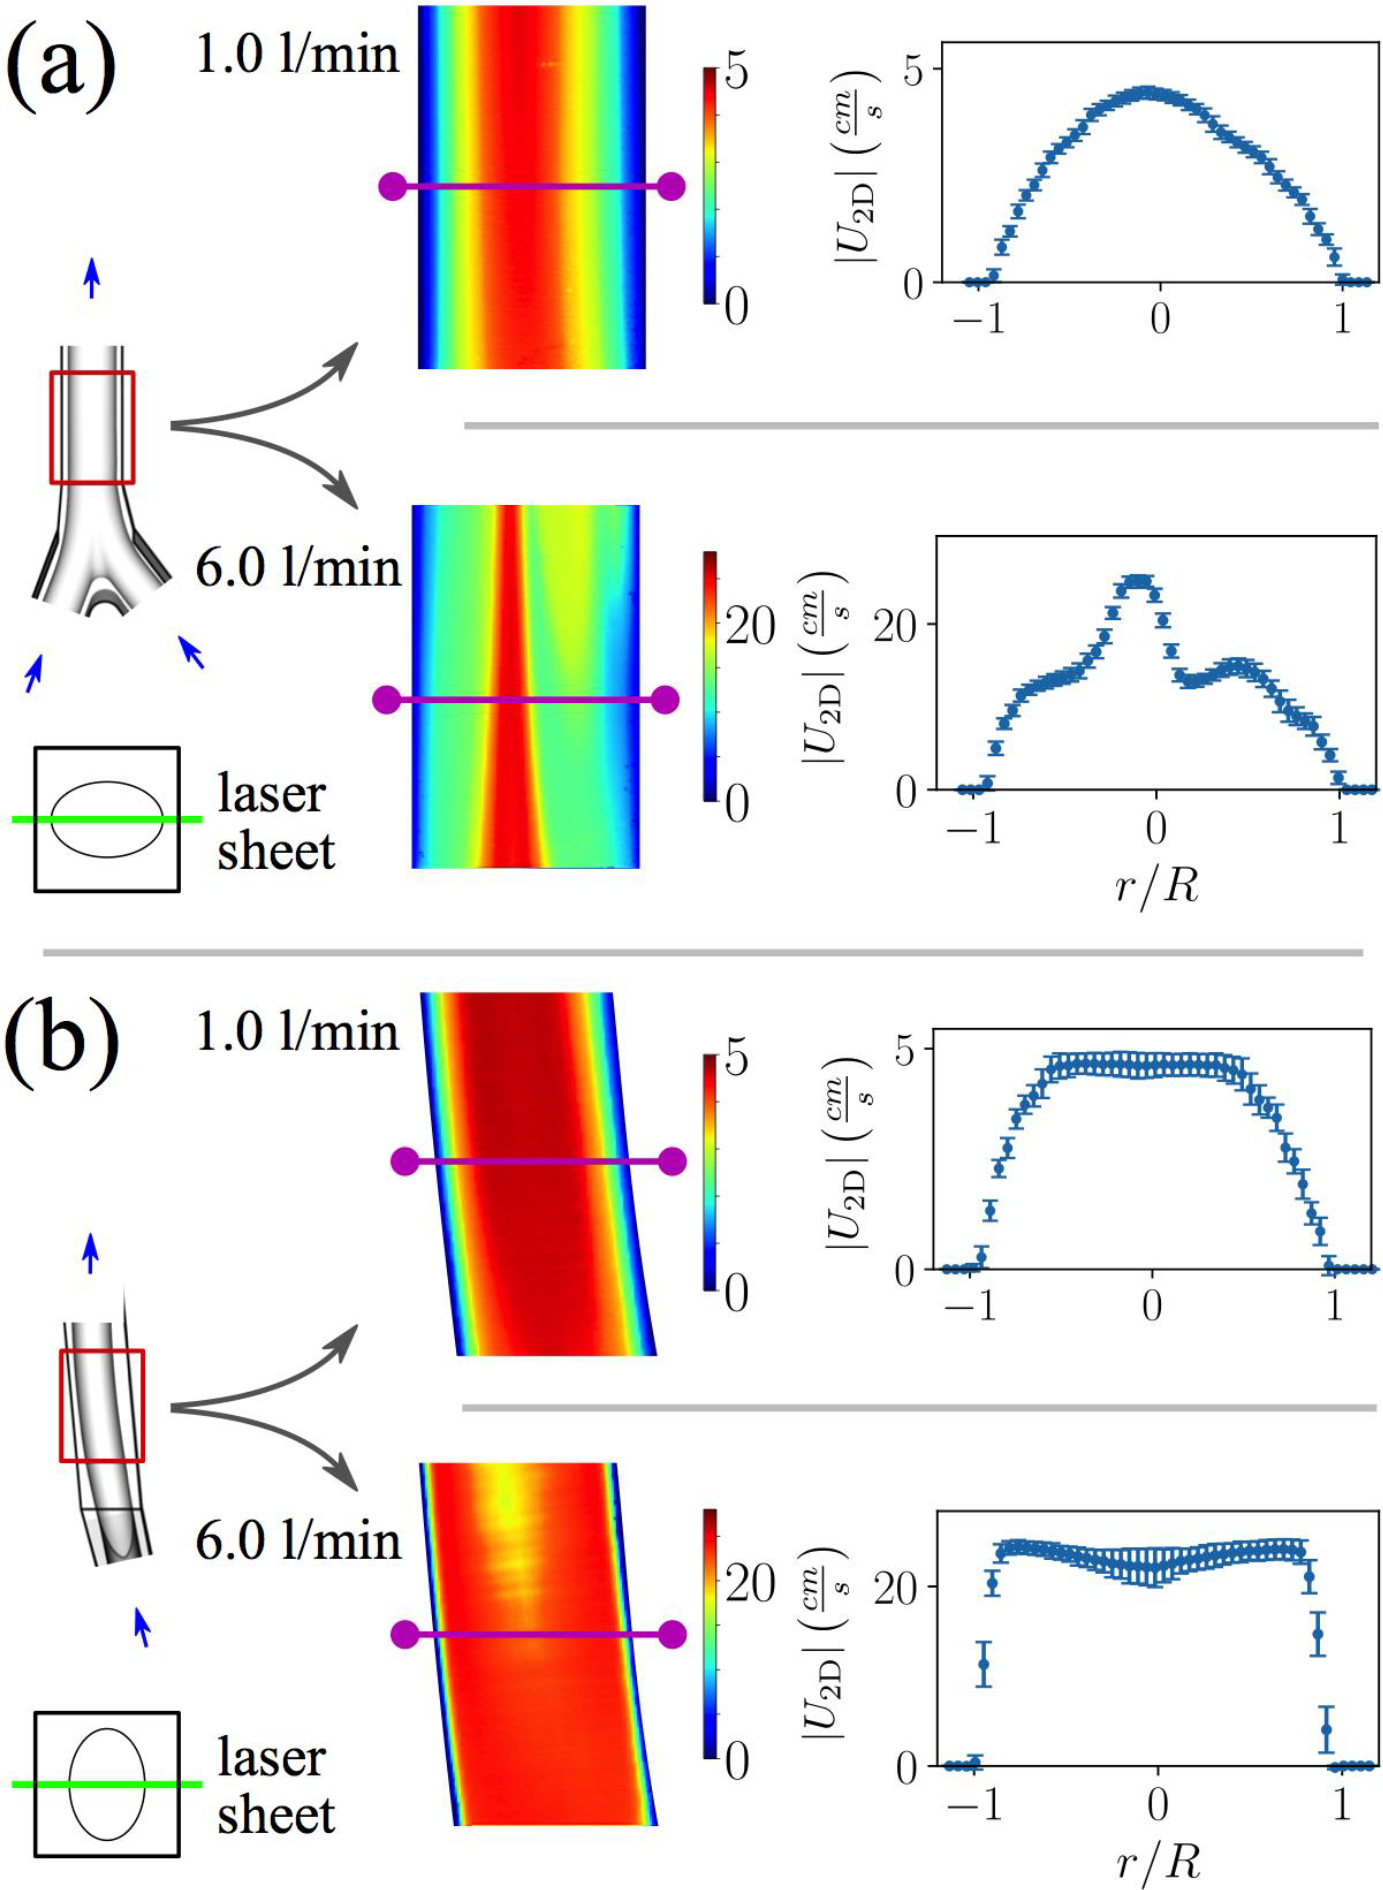
Figure 5:

Two-dimensional velocity magnitude contours for (a) coronal and (b) sagittal planes in the infrarenal IVC at resting and exercise flow rates. Flow profiles are extracted midway down the PIV planes (magenta lines) and plotted with error bars representing the experimental variability (one standard deviation). The flow becomes more complex at the higher flow rate, with more inflections points in the flow profiles.
