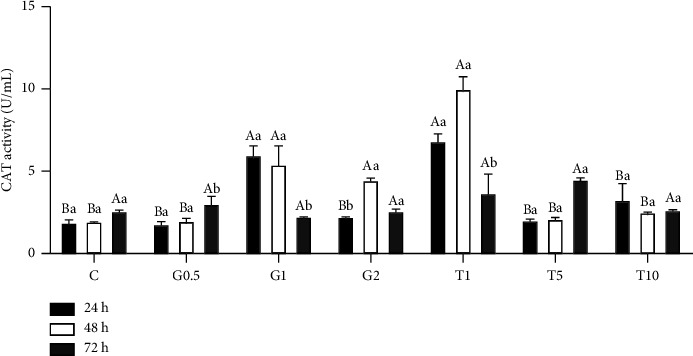
Figure 4.

CAT activity in response to different concentrations of GSH and taurine and chilling for up to 72 h. C represents the control samples (no treatment) stored at 5°C for 24, 45, and 72 h, and G1, G2, and G0.5 represent 1, 2, and 0.5 mM of GSH treatments stored at 5°C for 24, 45, and 72 h, respectively. T1, T5, and T10 denote 1, 5, and 10 mM of taurine supplementation after different postchilling times (24, 48, and 72 h) at 5°C. Different uppercase and lowercase letters indicate statistical significances at P < 0.05 between different chilling times and extender supplements (GSH and taurine), respectively.
