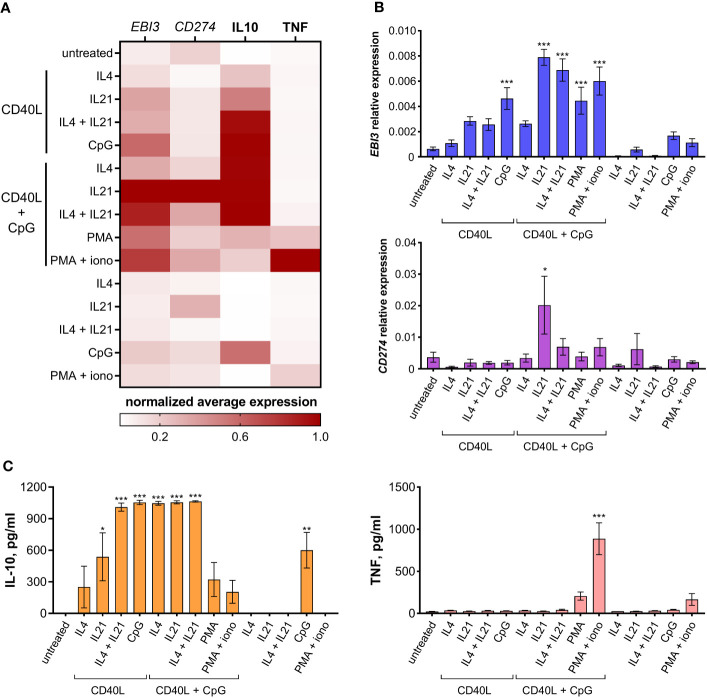
Figure 2.
Immunoregulatory molecular profile of differentially activated B cells. (A) Heatmap showing EBI3, CD274, IL10, and TNF normalized average expression levels in differentially activated B cells. (B) EBI3 and CD274 relative expression levels were determined by RT-PCR using total RNA extracted from differentially activated B cells on day 7 of cultivation. (C) IL10 and TNF levels were determined by ELISA in the medium from differentially activated B cells on day 7 of cultivation. Mean values ± SEM of at least four independent experiments is shown. *P < 0.05, **P < 0.01, ***P < 0.001 compared to untreated control, as calculated by ANOVA.

