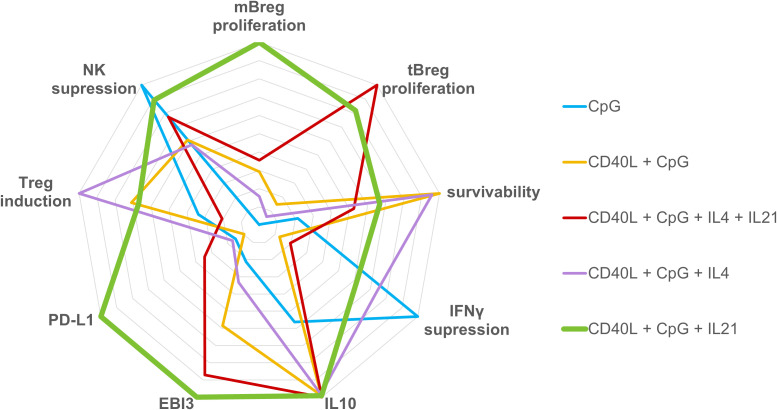
Figure 4.
Radar graph representing the regulatory phenotype of B cells induced by various activation stimuli. Axes display immunosuppressive parameters of activated B lymphocytes assessed in the study. All data from Figures 1 - 3 used for immunogram construction were proportionally normalized to a single scale from 0 to 10. The values of each axis have been joined to form the central polygon area, which represents the general regulatory phenotype induced by various activation cocktails.

