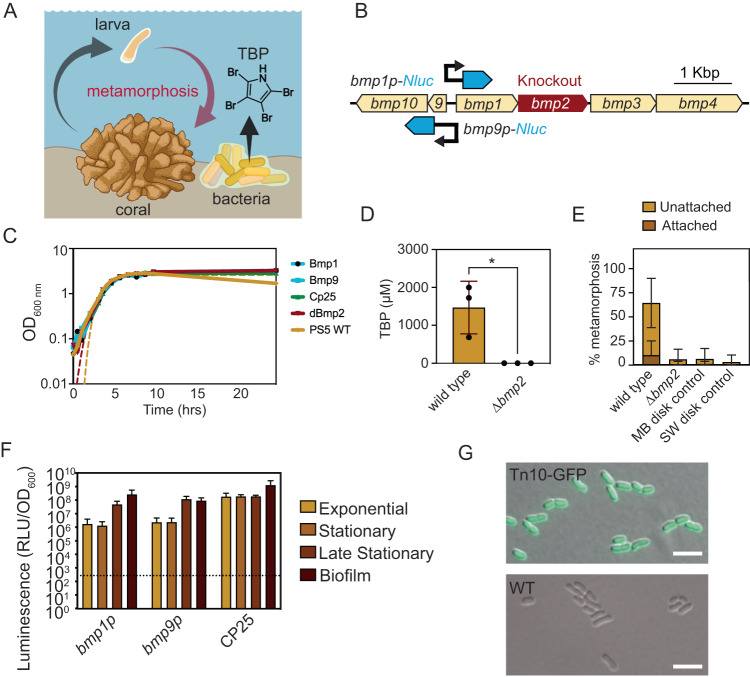
Fig. 1. TBP biosynthesis in Pseudoalteromonas sp. PS5 induces metamorphosis of the stony coral Porites astreoides.
A A model of TBP biosynthesis in Pseudoalteromonas sp. PS5 and its ability to induce coral metamorphosis. B Synteny of the bmp gene cluster in Pseudoalteromonas sp. PS5 (Genbank accession KR011923) created with EasyFig (V1.4.4) [23]. The 5’UTR for both bmp1 and bmp9 were cloned and fused to a Nanoluc (Nluc) reporter shown in blue. The bmp2 brominase is highlighted in red. C Growth curve of Pseudoalteromonas sp. PS5 wild type, ∆bmp2 and strains expressing plasmids bmp1-NLuc, bmp9-NLuc, and CP25-gfp. Optical density (OD) measurements were taken at 600 nm wavelength and graphed on a Log10 scale. Dotted lines correspond to the Gompertz non-linear regression fit for wild type and ∆bmp2. Plotted is the average of two biological replicates. D LC-MS/MS of Pseudoalteromonas sp. PS5 wild type and bmp2 knockout quantifying tetrabromopyrrole production (N = 3 extractions per treatment extracted from replicate 5 mL liquid cultures, one-tailed Mann–Whitney test, P = 0.05). Error bars show standard deviations. E Metamorphosis biofilm assays (%) with Porites astreoides larvae (10 larvae/ dish) in response to Pseudoalteromonas sp. PS5 wild type and ∆bmp2 strains. Controls include disks incubated in sterile Marine Broth (MB) media or filtered seawater (SW). N = 25 total dishes per treatment, including 3 experiments with either 5 or 10 replicates spanning two collection years. Combined morphogenesis significance is shown (Dunn’s multiple comparison of wild type vs ∆bmp2, Adjusted P < 0.0001). F Luciferase assays of bmp1 and bmp9 promoter activity under different modes of growth reported in relative luminescence units normalized by the optical density (RLU/OD600) and plotted on the Log10 scale. The 5’UTR of bmp1 and bmp9 were compared against the negative control background (Pseudoalteromonas sp. PS5 cells expressing a non-luminescent plasmid) as represented by the dotted line (Y = 60,422 RLU/OD600). Error bars show standard deviation of the mean. N = 4 biological replicates. G Strong and uniform expression of the genomic GFP tag in the Pseudoalteromonas transconjugants observed with fluorescence microscopy (top). The bottom panel is the wild type Pseudoalteromonas sp. PS5 for comparison. Scale bar is 5 µm.

