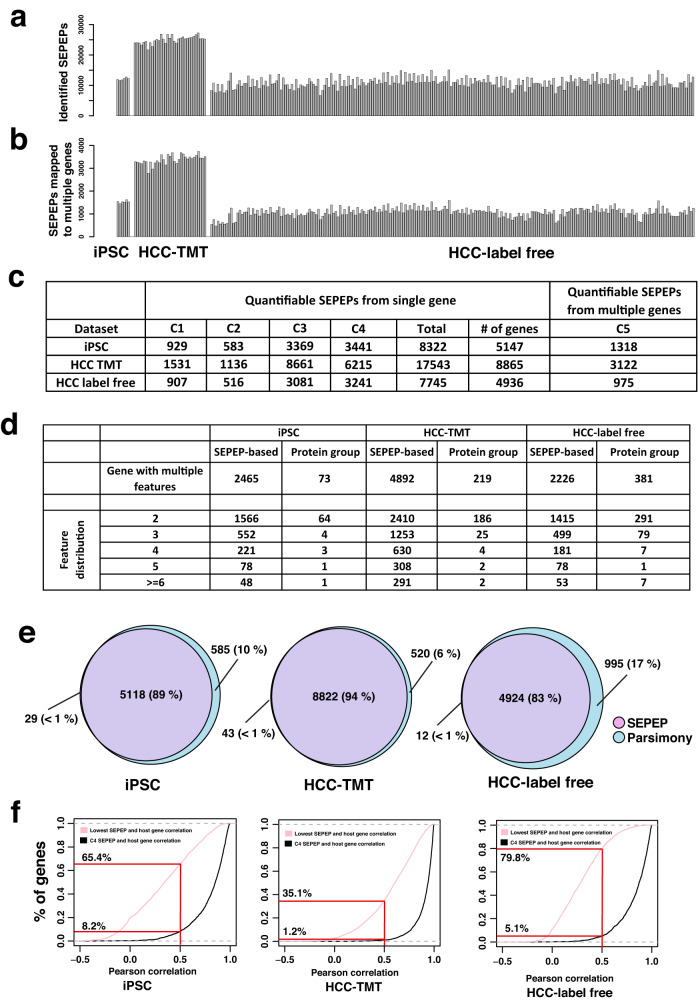
Fig. 3. SEPEP-level quality control and quantification in three selected datasets.
a Numbers of identified SEPEPs in three studies. b Numbers of multi-gene SEPEPs passing FDR control. c Class distribution of the quantifiable SEPEPs. d Comparison of numbers of genes with multiple SEPEPs in SEPepQuant analysis and those with multiple protein groups in parsimonious inference. e Overlap of genes with quantifiable single-gene SEPEPs and quantifiable genes by parsimonious inference. f Distributions of the correlations between C4 SEPEPs and host genes (black curves) and the lowest correlations between SEPEPs and host genes (pink curves). Source data of (a, b, e, f) are provided as a Source Data file.

