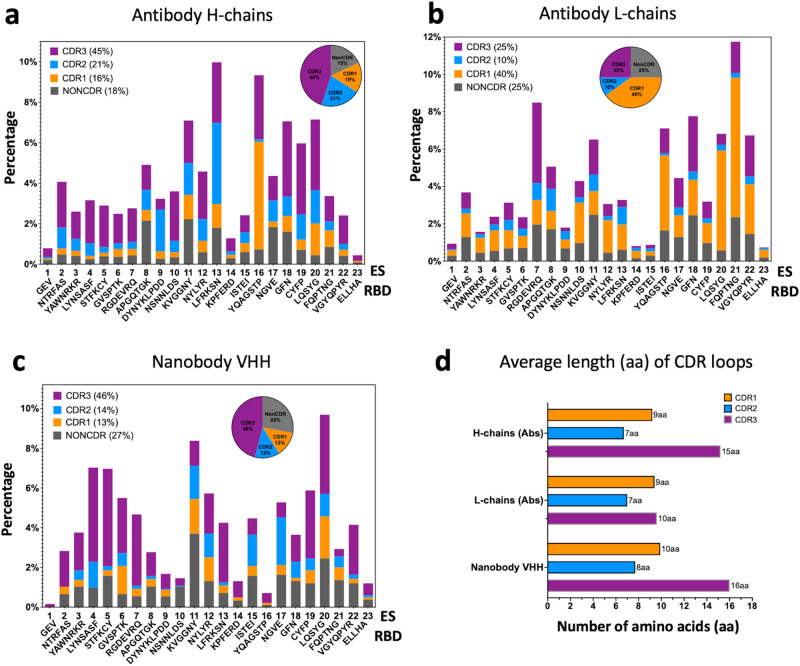
Fig. 3. Distribution of CDR loops of contacts to RBD surface over ES.
a Antibody H chains are plotted (percentage). Pie graph indicates the composition of CDR1 (16%, orange), CDR2 (21%, marine blue), CDR3 (45%, purple) and non-CDR (18%, gray) respectively. b Antibody L chains are plotted (percentage). Pie graph indicates the composition of CDR1 (40%, orange), CDR2 (10%, marine blue), CDR3 (25%, purple) and non-CDR (25%, gray) respectively. c Nanobody chains are plotted (percentage). Pie graph indicates the composition of CDR1 (13%, orange), CDR2 (14%, marine blue), CDR3 (46%, purple) and non-CDR (27%, gray) respectively. d Average length (in amino acids (aa)) of CDR loops extracted from the sequences (CovAbDab26, as of 12/20/2022) and used in this study. The averages are over 340 antibodies and 83 nanobodies respectively.

