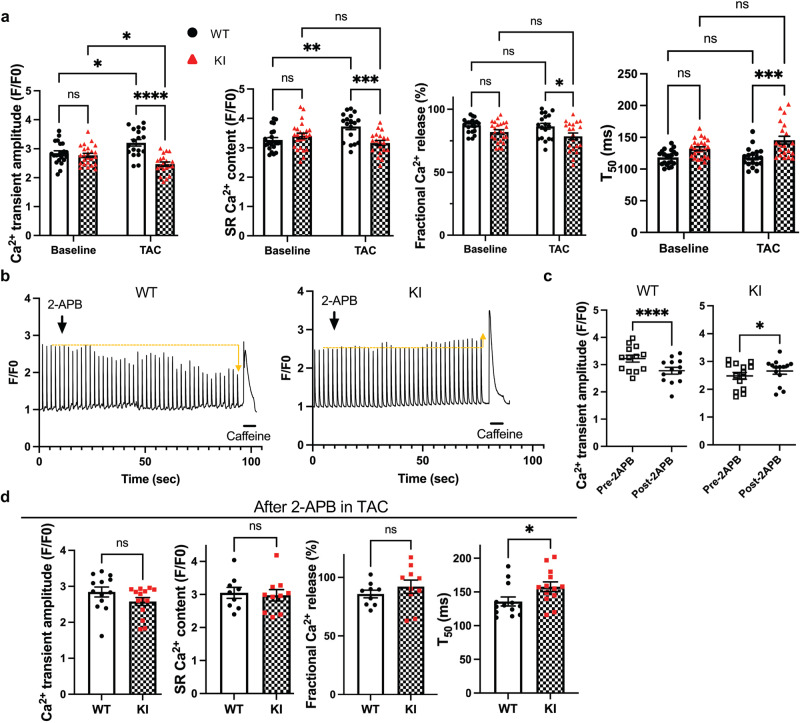
Fig. 4. Wild type (WT), but not Bcl-xL-S14A knock-in (KI), cardiomyocytes exhibit increases in Ca2+ transient amplitude and sarcoplasmic reticulum (SR) Ca2+ content after TAC-induced pressure overload, which are suppressed by IP3R inhibition.
a Hemodynamic stress differentially alters intracellular Ca2+ dynamics in WT and KI cardiomyocytes, as shown in the Ca2+ transient amplitude, SR Ca2+ content, fractional Ca2+ release, and T50. Cardiomyocytes were isolated from the indicated mouse hearts 1 day after TAC. WT baseline n = 21; WT TAC n = 18; KI baseline n = 24; KI TAC n = 20 from 3 hearts/group. Two-way ANOVA with Tukey’s multiple comparison test. b Representative traces of Ca2+ transient (F/F0) with 2-APB treatment in WT and KI cardiomyocytes 1 day after TAC. Orange dotted lines indicate the level of F/F0 at the time of 2-APB administration and arrows indicate the direction of change in F/F0. c Ca2+ transient amplitude before and after 2-APB treatment in cardiomyocytes 1 day after TAC. WT n = 13; KI n = 14 cells from 3 hearts/group. Two-sided paired t test (WT) or Wilcoxon matched-pairs signed rank test (KI). d Quantification of intracellular Ca2+ dynamics after 2-APB treatment in WT and KI cardiomyocytes 1 day after TAC. WT n = 13 and KI n = 14 cells (Ca2+ transient amplitude, two-sided Mann-Whitney U test); WT n = 9 and KI n = 10 cells (SR Ca2+ content and fractional Ca2+ release, two-sided unpaired t test); WT and KI n = 13 cells (T50, two-sided Mann-Whitney U test) from 3 hearts/group. ****p < 0.0001, ***p < 0.001, **p < 0.01, *p < 0.05, ns not significant. Adjusted p values for (a): 0.0216 (Ca2+ transient amplitude, WT, Baseline vs TAC), 0.0435 (Ca2+ transient amplitude, KI, Baseline vs TAC), 0.0071 (SR Ca2+ content, WT, Baseline vs TAC), 0.0007 (SR Ca2+ content, TAC, WT vs KI), 0.0423 (Fractional Ca2+ release, TAC, WT vs KI), 0.0001 (T50, TAC, WT vs KI). Adjusted p values for (c): 0.0353 (KI, Pre-2APB vs Post-2APB). Adjusted p values for (d): 0.0373 (T50, WT vs KI). Data are mean ± SEM. Source data are provided as a Source Data file.

