Figure 2.

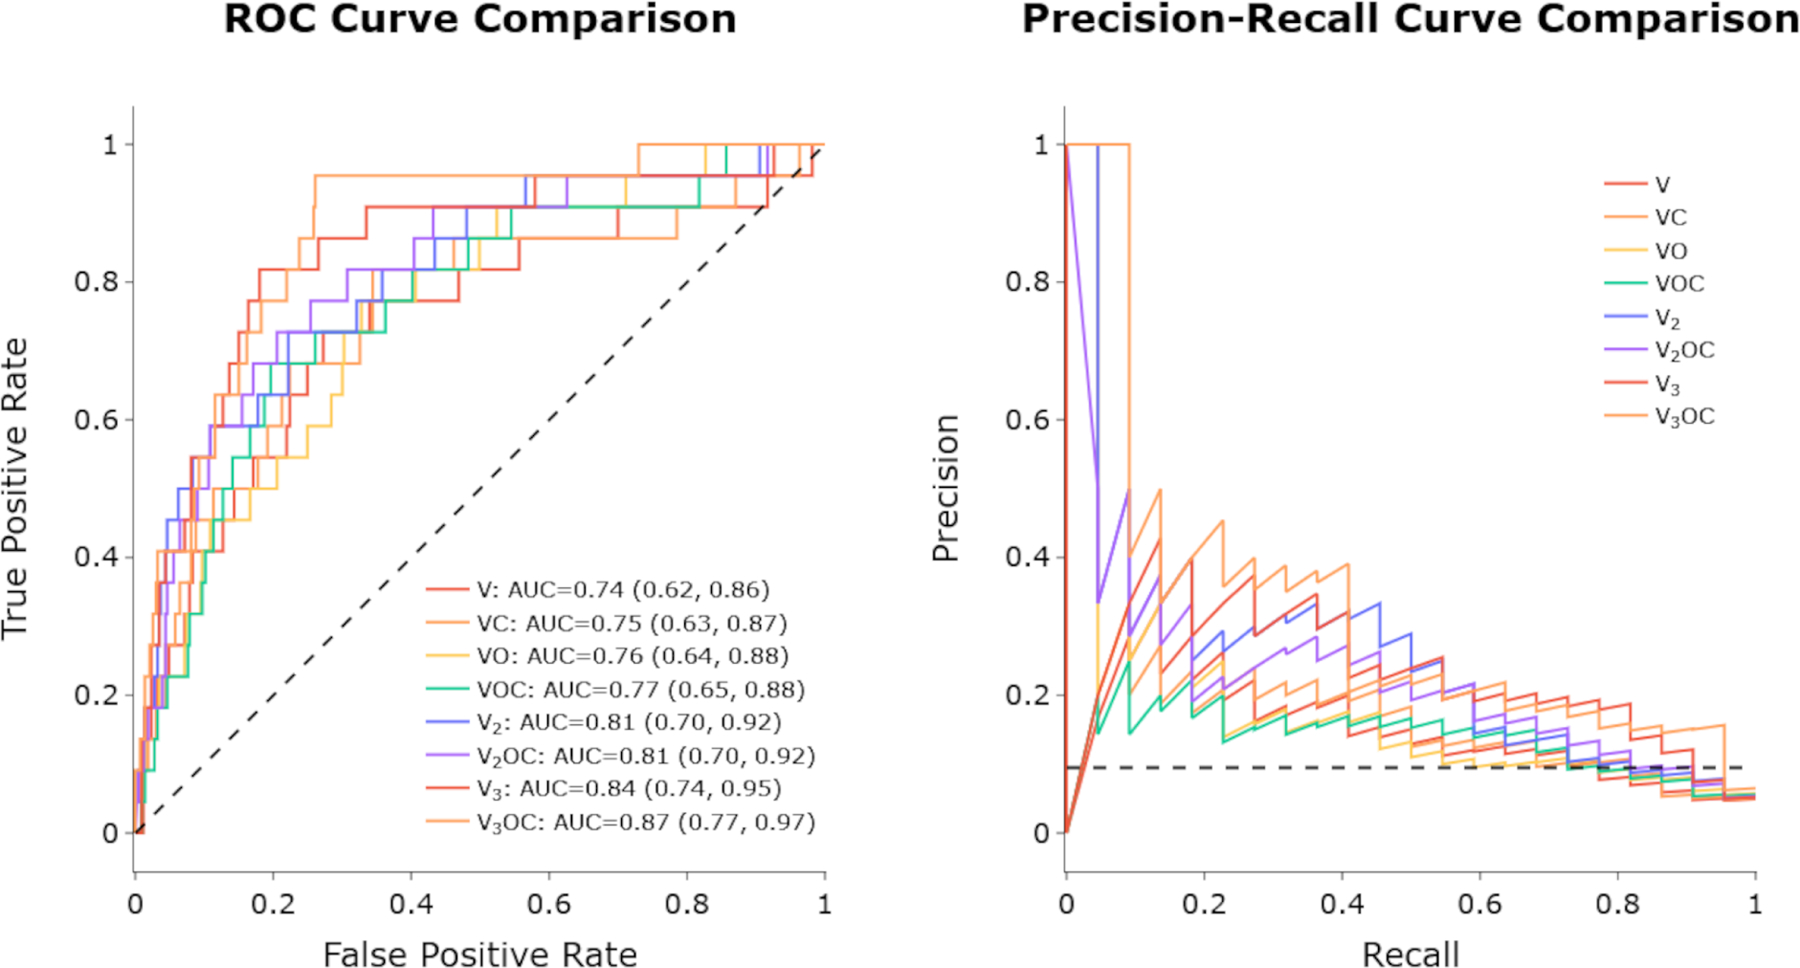
ROC curves (left) and PR curves (right) of the different models. Curves are color-coded in a rainbow fashion, starting at red for V and up to violet for V3OC.

ROC curves (left) and PR curves (right) of the different models. Curves are color-coded in a rainbow fashion, starting at red for V and up to violet for V3OC.