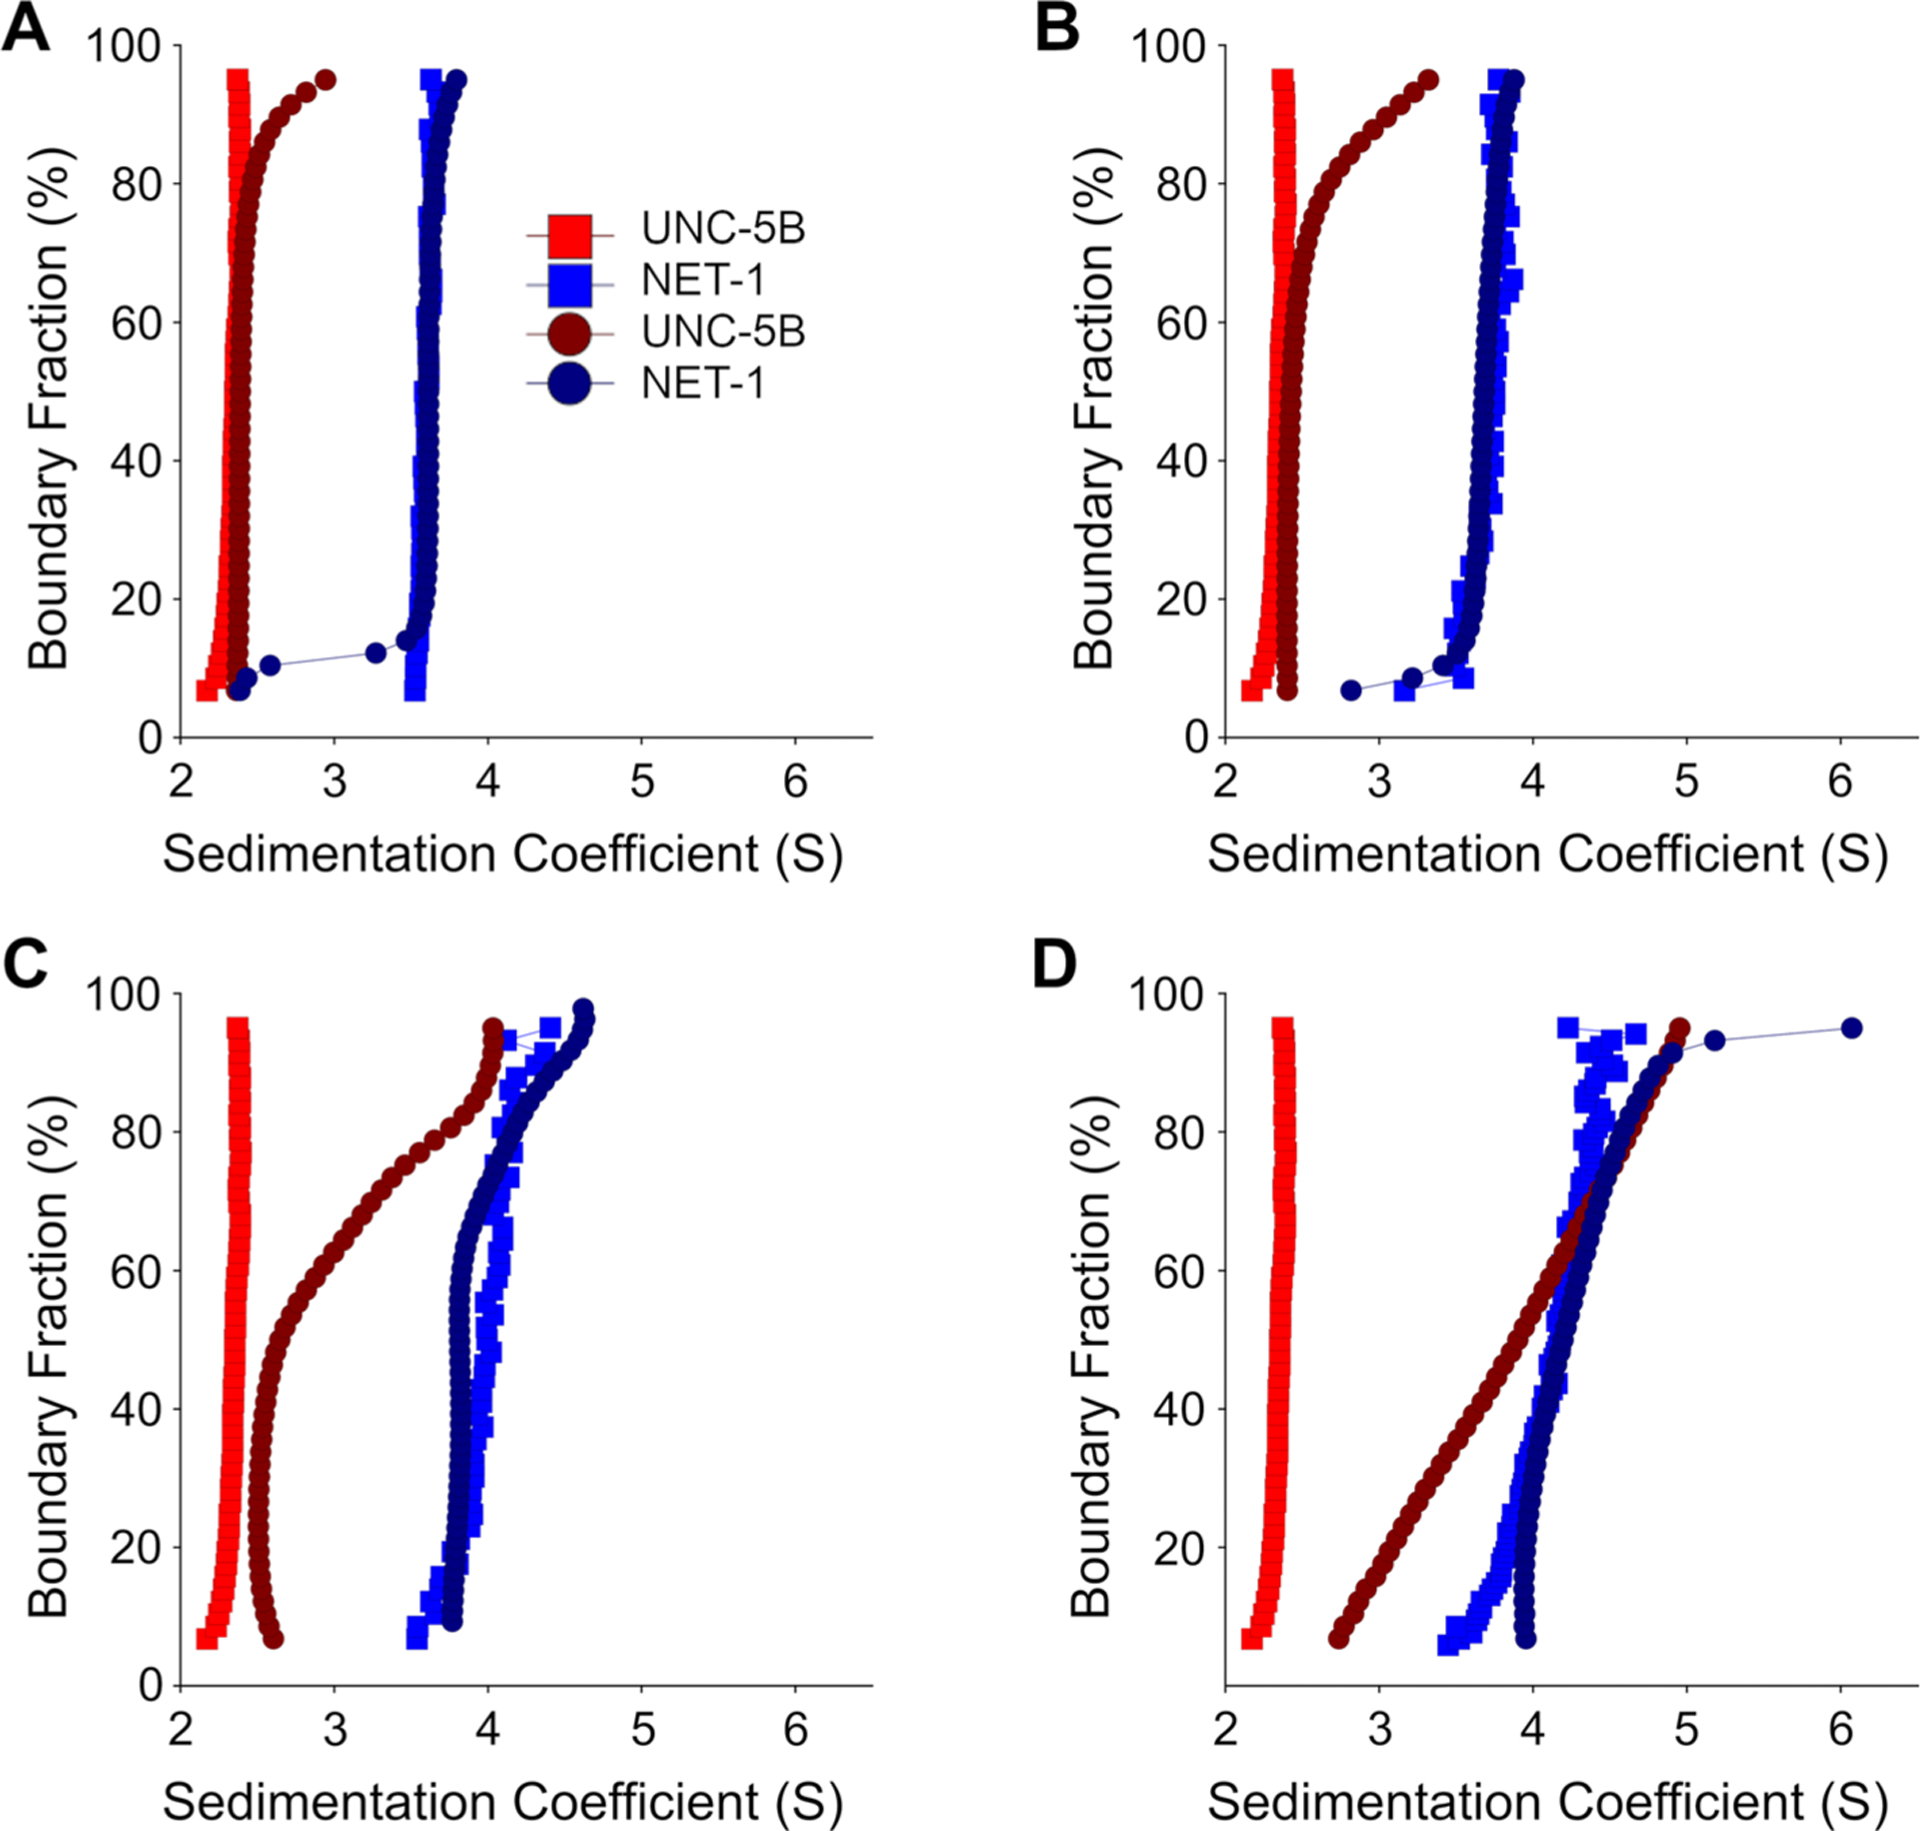
Fig. 3.

Diffusion-corrected integral sedimentation coefficient distributions of the deconvoluted NET-1 and UNC-5 titration series in pH 7.5. Each plot shows 8 μM UNC-5 alone (Red squares), 10 μM NET-1 alone (Blue squares), deconvoluted UNC-5 (Dark red circles) and NET-1 (Dark blue circles) at at A 1:2, B 1:1, C 2:1, and at D 6:1 molar ratios of NET-1 to 5 μM UNC-5
