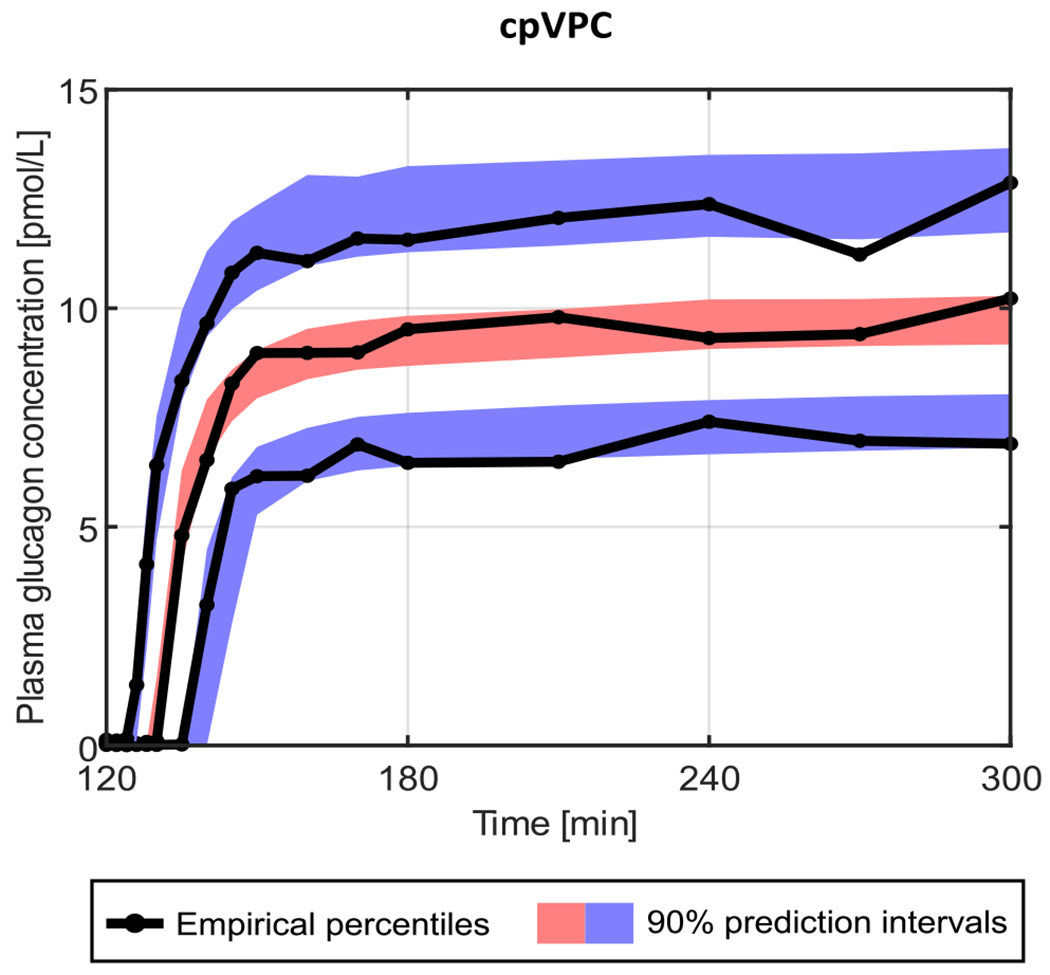
Fig. 4.

Visual predictive check obtained with the final model. The 90% prediction intervals of the 10th (blue lower area), 50th (red central area), and 90th (blue upper area) percentiles are compared with the 10th, 50th, and 90th empirical percentiles (black solid lines).
