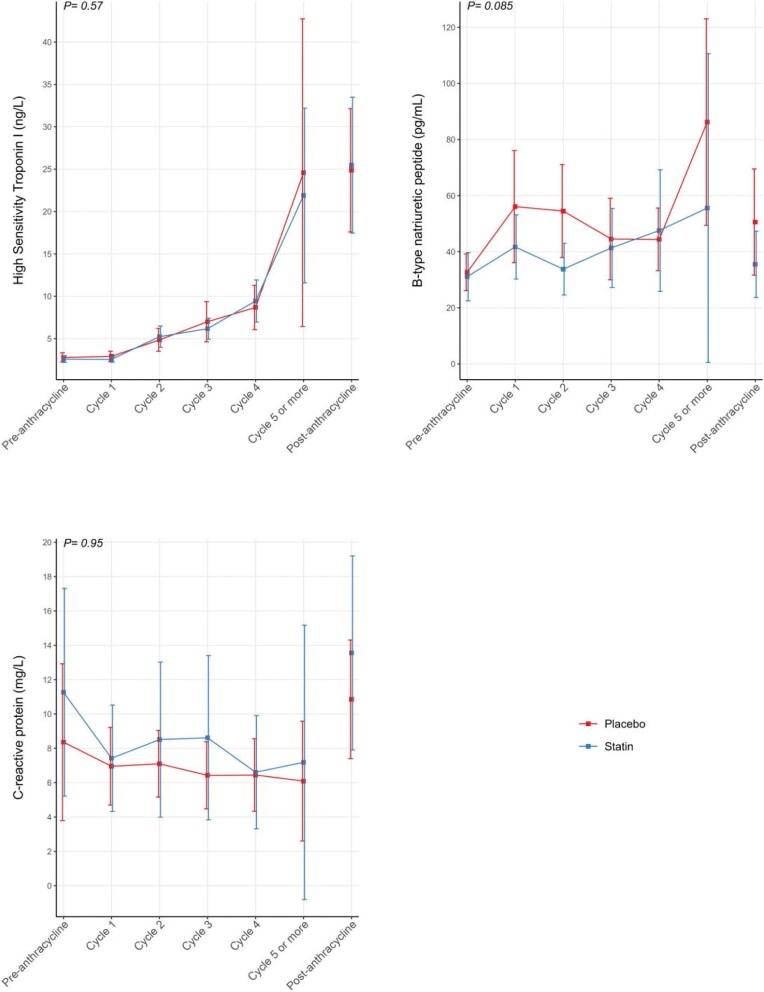
Figure 3.
Trajectory of high sensitivity troponin I, B-type natriuretic peptides, C-reactive proteins measured pre- and post-anthracycline, and each anthracycline cycle are summarized. The group-specific trajectories were estimated using GEE with cycles as a categorical variable, and the corresponding 95% CIs were estimated based on robust sandwich estimators. Given the variability in the number of cycles between patients and fewer patients receiving more than five cycles, we lumped all observations at Cycle 5 and all subsequent cycles into one single category. In addition, we included the estimates and the CI at the end of anthracycline treatment without connecting the trajectories to signal that not all patients received five cycles of anthracycline. Note that patient-specific data points in all cycles are shown in Supplementary material online, Fig. S2.

