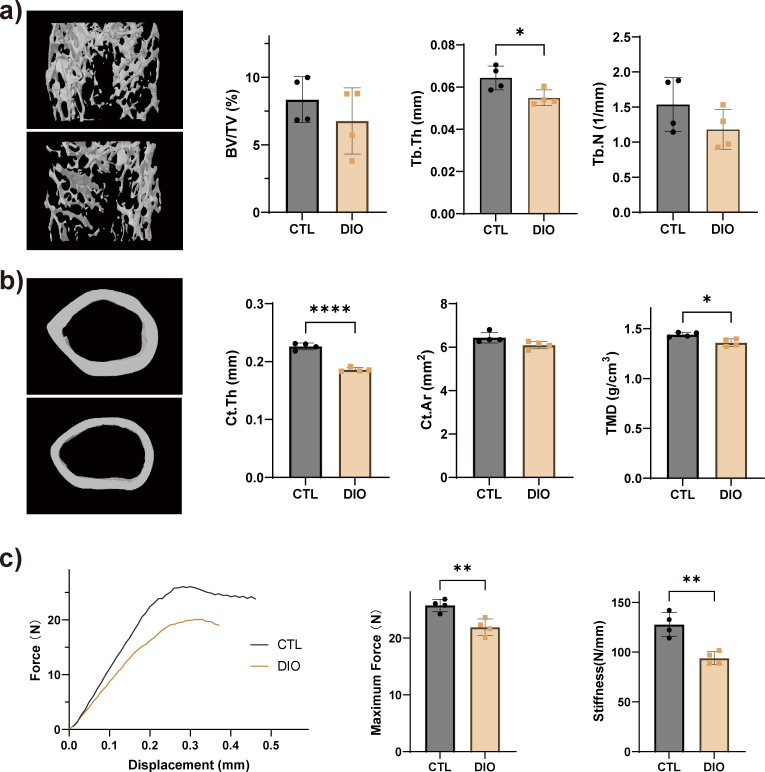
Fig. 3.
Obesity reduces bone mass and bone strength. Representative micro-CT (μCT) reconstruction images and microarchitecture quantification of femoral a) trabecular distal metaphysis and b) mid-diaphyseal cortical bone in control (CTL) and diet-induced obese (DIO) mice. c) The mechanical properties of the tibia were quantified using a three-point bending test; stiffness and maximum force were reduced in DIO animals (n = 4). Data are expressed as means and standard deviations. *p < 0.05, **p < 0.01, ****p < 0.0001 compared with CTL (independent-samples t-test). BV/TV, trabecular bone mass; Ct.Ar, cortical area; Ct.Th, cortical bone thickness; Tb.N, trabecular number; Tb.Th, trabecular thickness; TMD, tissue mineral density.

