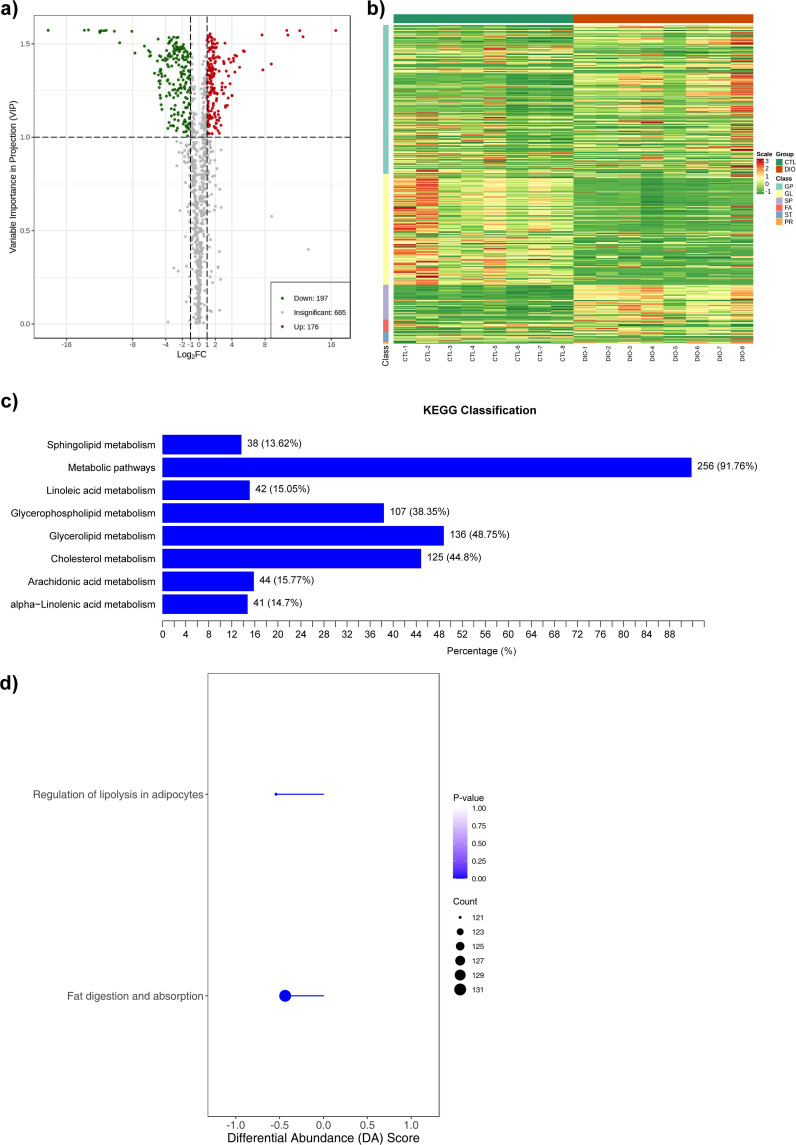
Fig. 4.
Lipidomics sequencing and functional enrichment analysis. a) Volcano diagram of differential metabolites (n = 8), with each point representing one metabolite; the green points represent downregulated metabolites (fold change (FC) ≤ 0.5) and the red points represent upregulated metabolites (FC ≥ 2); the x-axis represents the logarithmic value (log2FC) of the relative content difference multiple of a metabolite in two groups of samples, and the y-axis represents the variable importance in projection (VIP) value. b) A cluster heat map of the differential metabolites (n = 8). The x-axis shows sample information and the y-axis shows differential metabolite information. The reported p-value represents the actual value derived from the implementation of the hypergeometric test. c) The main enriched metabolic pathways (n = 8). The y-axis shows the Kyoto Encyclopedia of Genes and Genomes (KEGG) metabolic pathway and the x-axis shows percentage. d) Overall changes in the KEGG metabolic pathways (n = 8). Metabolic pathway names on the y-axis and differential abundance (DA) scores on the x-axis. The hypergeometric test's p-value (< 0.05) indicated significant enrichment of pathways. FA, fatty acyls; GL, glycerolipids; GP, glycerophospholipids; PR, prenol lipids; SP, sphingolipids; ST, sterol lipids.

