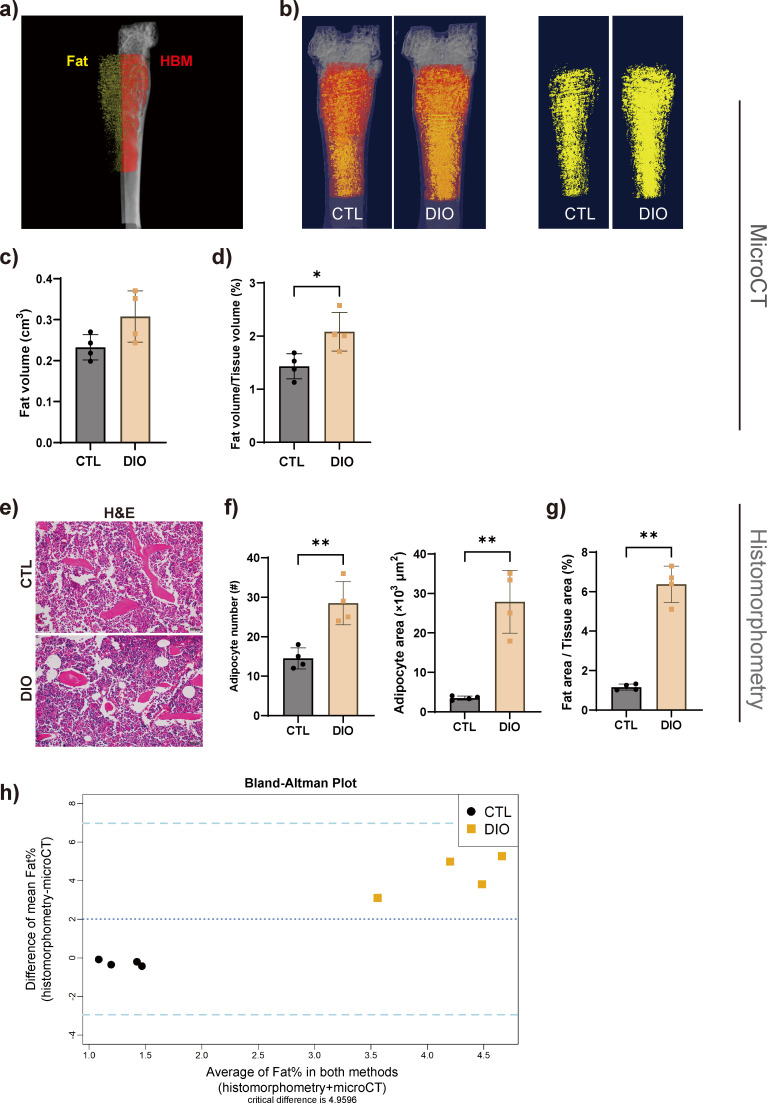
Fig. 5.
Marrow adipose tissue (MAT) is increased in diet-induced obese (DIO) mice. a) and b) The MAT content was displayed and quantitatively analyzed by micro-CT 3D imaging (n = 4). c) and d) Results showed that the proportion of fat increased in DIO mice. e) to g) MAT was measured in haematoxylin and eosin (H&E)-stained tissue; the results revealed an increase in the area and number of adipocytes as well as the fat area to tissue area ratio. Magnification in e): 400×. h) Bland-Altman plot analysis showed that the two measurement methods had a certain degree of consistency. The upper and lower dashed lines represent ± 2 standard deviations (SDs), and the middle-dashed line represents the mean (n = 4). Data are expressed as means and SDs. *p < 0.05, **p < 0.01 compared with CTL (independent-samples t-test). CTL, control; HBM, haematopoietic bone marrow.

