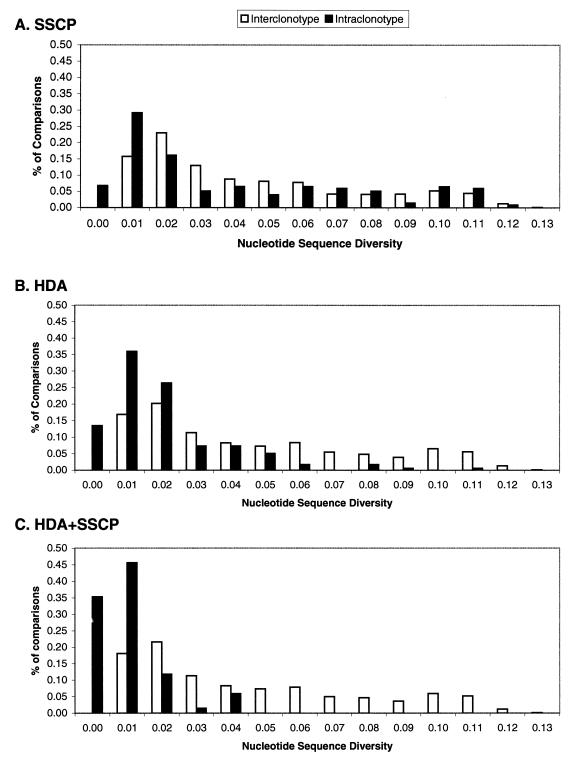
FIG. 3.
Frequency distributions of intraclonotype and interclonotype diversity for all samples. All possible pairwise sequence comparisons were performed and classified as interclonotype or intraclonotype based on the results of HDA, the SSCP method, or the HDA+SSCP method. A histogram of the resulting percent diversity is displayed.

