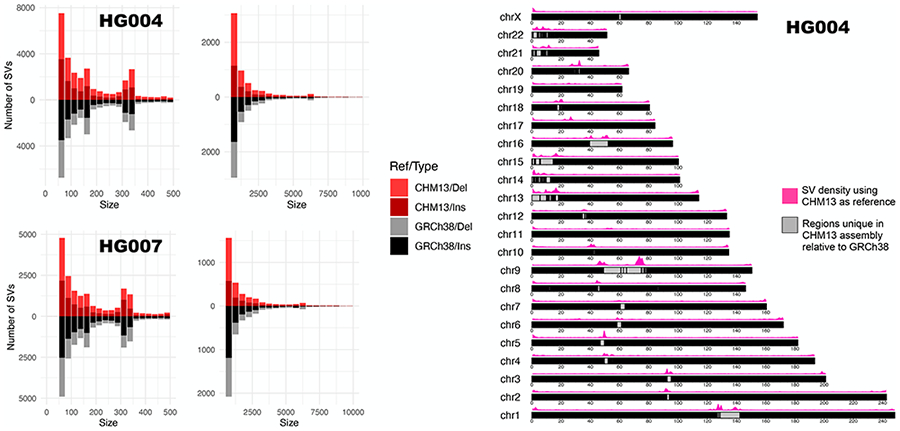
Figure 6:

The left plots indicate the size distribution of SVs computed by Winnowmap2-Sniffles pipeline using HG004 and HG007 samples. Here we used both GRCh38 and T2T CHM13 human assembly as reference. The right plot shows the positional density of SVs found in HG004 sample using an ideogram plot [48] of the T2T CHM13 human assembly (v1.0). Significant enrichment of structural variation occurs in unique and newly resolved repetitive portions of the assembly.
