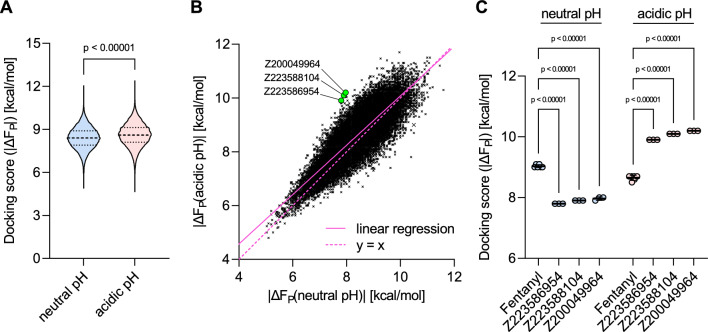
Fig. 6.
Results of differential docking of ligand library B, extracted from the Enamine GPCR library. A Distribution of docking scores at neutral and acidic pH, binding free energies and , respectively. Paired t-test, two-tailed. B Docking scores of ligands to the MOR at neutral (x-axis) are plotted against docking scores to the MOR at acidic pH (y-axis). The best acidic pH-specific hit molecules are highlighted [Z223586954, Z223588104, Z200049964 (neon green)]. Individual data points in C show scores of replicate dockings, horizontal bars indicate mean values, and error bars indicate standard deviations (SD). Mean docking scores were analyzed by two-way ANOVA with Šídák’s multiple comparisons test

