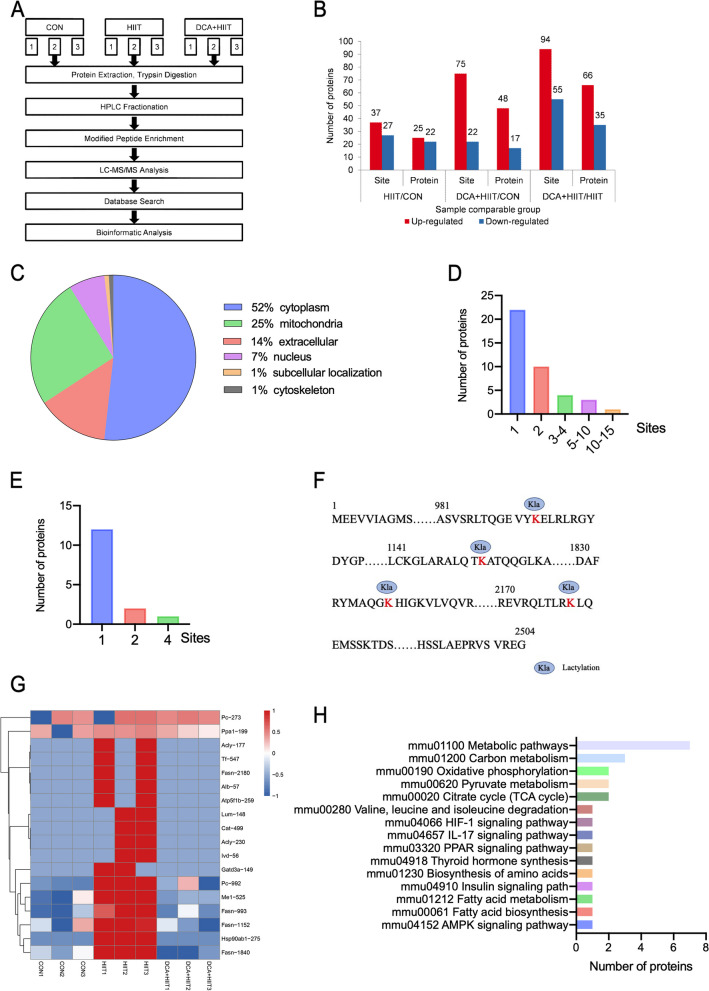
Fig. 3.
Detection and profile of lysine lactylation in mice iWAT. A Schematic representation of the experimental workflow for 4D label-free lactylation quantitative proteomics in CON, HIIT, and DCA + HIIT mice. B Distribution of the number of differentially lactylated lysine sites and proteins. C Pie chart of the predicted subcellular localization of lysine lactylated proteins. D Distribution of the number of lysine lactylation sites per protein that were significantly upregulated (fold change > 1.3, p < 0.05) and downregulated (fold change < 0.7, p < 0.05) among groups. Distribution of the number (E), hierarchical clustering and heatmap analysis (G), and KEGG pathway analysis (H) of lysine lactylation sites per protein that were upregulated in HIIT mice and downregulated in DCA + HIIT mice. F Lysine lactylation sites of FASN; n = 3. KEGG Kyoto Encyclopedia of Genes and Genomes, HIIT high-intensity interval training, DCA + HIIT dichloroacetate injection + high-intensity interval training

