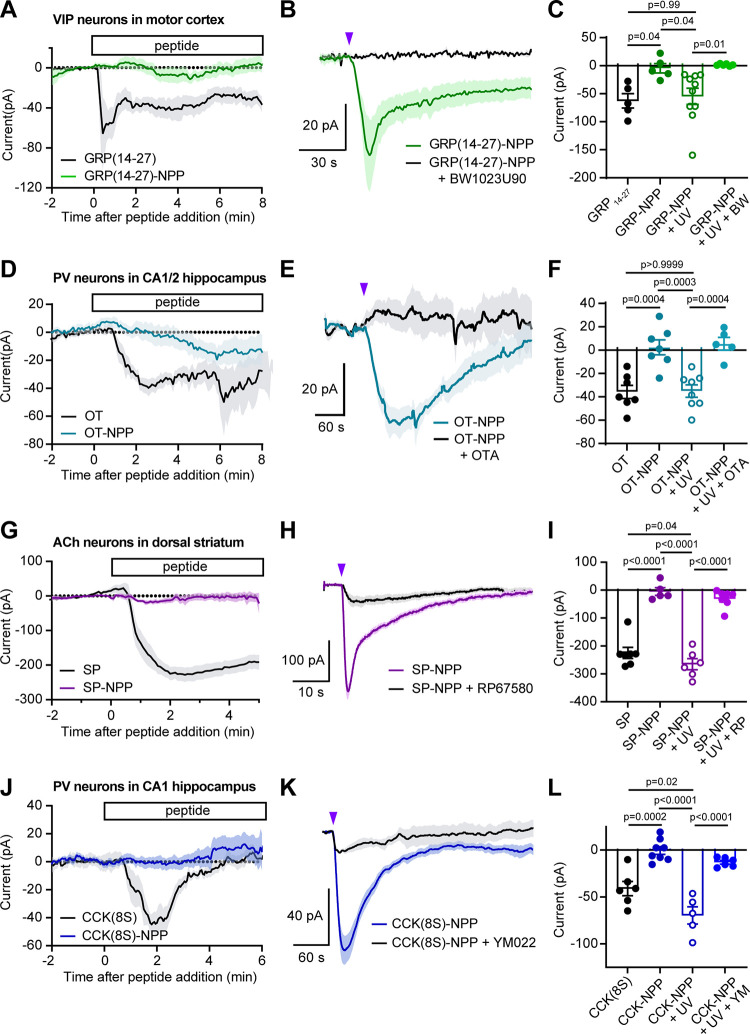
Figure 4.
Electrophysiological validation of NPP-caged neuropeptides at endogenous receptors in acute brain slices. (A) Average inward currents over time after bath application of GRP(14-27)-NPP (3 μM, n = 5 cells from 4 mice) or GRP(14-27) (300 nM, n = 5 from 4 mice), recorded from fluorescently labeled VIP interneurons in layer 1 of the motor cortex. Data are expressed as the mean ± SEM. (B) Average inward currents evoked by photoactivation of GRP(14-27)-NPP (3 μM) with an 84 mW light flash in the absence (green, n = 10 cells from 4 mice) and presence of the GRPR antagonist BW1023U90 (1 μM) (black, n = 6 cells from 2 mice). (C) Summary of peak current amplitudes for the data shown in panels A and B. GRP(14-27) −62.8 ± 12.8; GRP(14-27)-NPP −4.8 ± 8.4; GRP(14-27)-NPP + UV −54.6 ± 14.4; GRP(14-27)-NPP + UV + BW1023U90 1.5 ± 0.7. Data are expressed as the mean ± SEM. Ordinary one-way ANOVA F (3, 22) = 6.37, p = 0.0028, p-values determined using Sidak’s multiple comparison’s test. (D) Average inward currents over time after bath application of OT-NPP (3 μM, n = 7 cells from 5 mice) or OT (300 nM, n = 7 from 4 mice), recorded from fluorescently labeled PV interneurons in the CA1 and CA2 regions of hippocampus. (E) Average inward currents evoked by photoactivation of OT-NPP (3 μM) with an 84 mW light flash in the absence (light blue, n = 8 cells from 4 mice) and presence of the OTR antagonist (OTA) (d(CH2)51,Tyr(Me)2,Thr4,Orn8,des-Gly-NH29)-Vasotocin (1 μM) (black, n = 5 cells from 2 mice). (F) Summary of peak current amplitudes for the data shown in panels D and E. OT −35.8 ± 5.7; OT-NPP 2.4 ± 6.5; OT-NPP + UV −35.1 ± 5.3; OT-NPP + UV + OTA 5.5 ± 5.5. Data are expressed as the mean ± SEM. Ordinary one-way ANOVA F (3, 23) = 14.83, p <0.0001, p-values determined using Sidak’s multiple comparison’s test. (G) Average inward currents over time after bath application of SP-NPP (1 μM, n = 6 cells from 5 mice) or SP (500 nM, n = 7 from 2 mice), recorded from fluorescently labeled cholinergic interneurons in the dorsal striatum. (H) Average inward currents evoked by photoactivation of SP-NPP (1 μM) with an 84 mW light flash in the absence (purple, n = 5 cells from 5 mice) and presence of the NK1R antagonist RP67580 (10 μM) (black, n = 6 cells from 3 mice). (I) Summary of peak current amplitudes for the data shown in panels G and H. SP −197.8 ± 20.1; SP-NPP −5.2 ± 13.6; SP-NPP + UV −265.5 ± 19.7; SP-NPP + UV + RP67580 −30. 9 ± 11.7. Data are expressed as the mean ± SEM. Ordinary one-way ANOVA F (3, 21) = 53.13, p <0.0001, p-values determined using Sidak’s multiple comparison’s test. (J) Average inward currents over time after bath application of CCK(8S)-NPP (3 μM, n = 8 cells from 6 mice) or CCK(8S) (500 nM, n = 6 from 3 mice), recorded from fluorescently labeled PV interneurons in the CA1 region of hippocampus. (K) Average inward currents evoked by photoactivation of CCK(8S)-NPP (3 μM) with an 84 mW light flash in the absence (blue, n = 5 cells from 3 mice) and presence of the CCK2R antagonist YM022 (1 μM) (black, n = 6 cells from 2 mice). (L) Summary of peak current amplitudes for the data shown in panels J and K. CCK −41.1 ± 7.6; CCK-NPP −0.4 ± 4.1; CCK-NPP + UV −69.6 ± 9.2; CCK-NPP + UV + 1 uM YM 022 −13.0 ± 2.0. Data are expressed as the mean ± SEM. Ordinary one-way ANOVA F (3, 21) = 26.59, p <0.0001, p-values determined using Sidak’s multiple comparison’s test.

