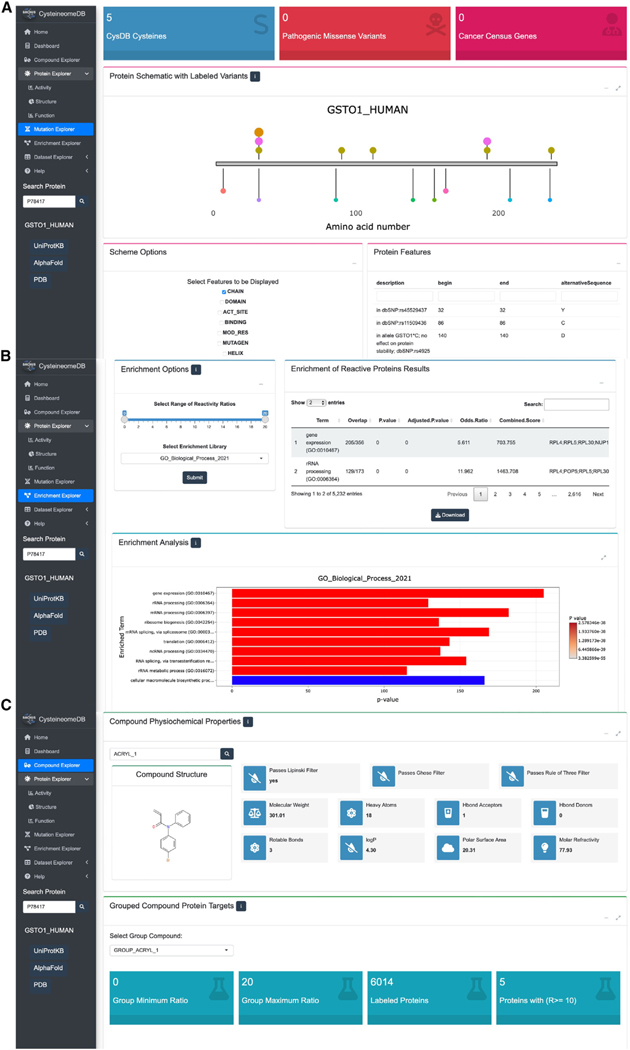
Figure 4. CysD enables disease, dataset, and cysteine-reactive compound wise queries.
(A) The disease relevance of a POI can be explored through the mutation page. Proximity of chemoproteomic detected cysteines, annotated small-molecule binders and variants of ranging clinical significance are visualized on a one-dimensional schematic of a protein sequence. Chemoproteomic cysteines are colored in gold for identified, pink for ligandable and orange for hyperreactive, while the remaining points are variant positions.
(B) Users can specify subsets of data available in CysDB, such as by compound chemotype or ranges of reactivity ratio, for pathway, ontology, and disease enrichment analyses. The results can then be downloaded as a CSV-formatted table or a bar graph as an image.
(C) Chemical structures and calculated “drug-likeness” properties of compounds used to ligand cysteines in CysDB can be accessed from the dropdown menu in the compound page.

