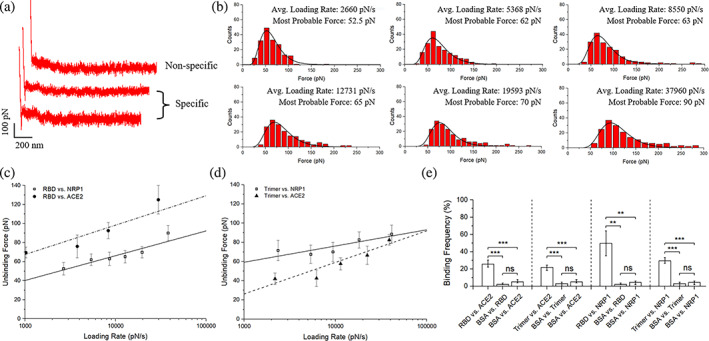
FIGURE 2.

SMFS results among SARS‐CoV‐2 S protein fragments, NRP1, and ACE2. (a) Typical force scans for nonspecific interaction and specific interaction. (b) Exemplary statistical analysis of force scan results from the RBD versus NRP1 experiments to determine most probable unbinding forces. (c) Dynamics force spectrum (DFS) with the linear fit for interactions between RBD and NRP1, compared with interactions between RBD and ACE2. (d) DFS with the linear fit for interactions between trimer and NRP1 with interaction between trimer and ACE2 as a comparison. (e) The interaction specificity is compared by the binding frequency among experiment groups and control groups using bovine serum albumin (BSA). Contact force, dwell time, and retraction speed during the binding frequency measurement were set to 200 pN, 0 s, and 3.7 μm/s, respectively. Error bars are given to show the range. Significance comparison was determined by unpaired t‐test. **<0.01; ***<0.001; ns: not significant. NRP1, neuropilin‐1; RBD, receptor‐binding domain; SARS‐CoV‐2, severe acute respiratory syndrome coronavirus 2; SMFS, single‐molecule force spectroscopy.
