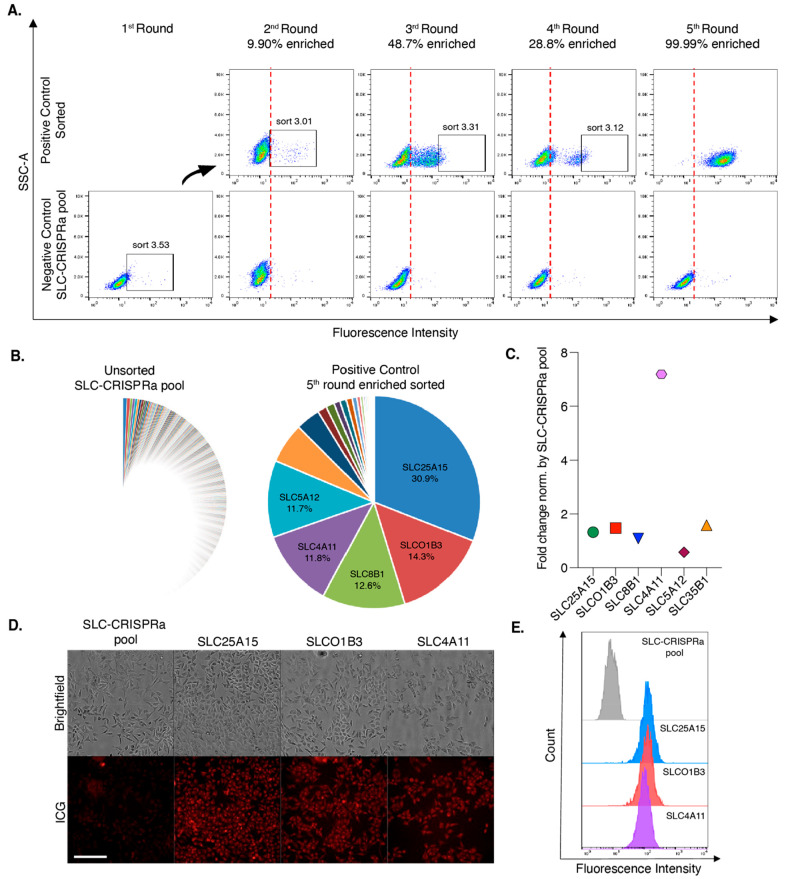
Figure 2.
Identification of putative ICG transporters using a SLC-CRISPRa screen. (A) Increase of the ICG (10 μM) fluorescence intensity after SLC-CRISPRa pool enrichment. The top 3% brightest population was sorted every week until the sorted population up to the 5th round achieved 99.99% enhancement. (B) Pie chart demonstrating the proportion of highly enriched sgRNAs in the unsorted SLC-CRISPRa pool and the 5th round enriched population. NGS count results are presented as percentages for the top five targets. (C) Gene expression patterns of the top five SLC genes in the 5th round enriched population. The fold change was normalized to the SLC-CRISPRa pool. Clones exhibited high ICG uptake, as demonstrated through (D) microscopy and (E) flow cytometry. Scale bar represents 200 μm.

