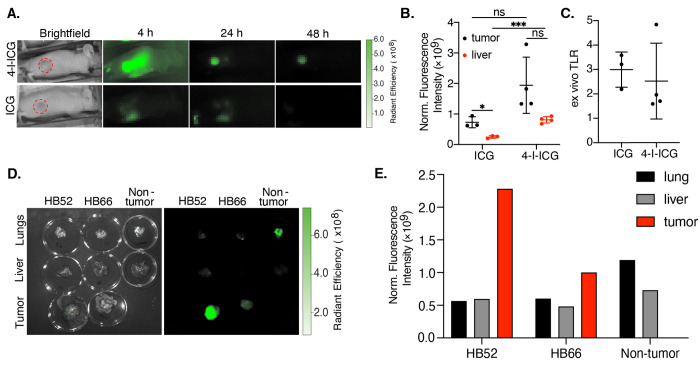
Figure 4.
(A) Fluorescent in vivo images of Hep3B-tumor-bearing mice treated with 4-I-ICG (2 mg/kg) and ICG (2 mg/kg) at 4, 24, and 48 h postinjection. Tumors are highlighted in red circles. (B) Ex vivo analysis of tumors (black) and livers (red) of Hep3B-tumor-bearing mice treated with 4-I-ICG (2 mg/kg) and ICG (2 mg/kg) at 48 h postinjection. Background is determined by the fluorescence signal from the neck. (C) Ex vivo tumor-to-liver ratios (TLRs) of Hep3B-tumor-bearing mice treated with 4-I-ICG and ICG at 48 h postinjection. (D) Fluorescent ex vivo images of tumors, livers, and lungs of HB52-, HB66-, or non-tumor-bearing mice treated with 4-I-ICG (10 mg/kg) at 72 h postinjection. (E) Ex vivo analysis of lungs, liver, and tumor of HB52-, HB66-, or non-tumor-bearing mice treated with 4-I-ICG (10 mg/kg) at 72 h postinjection, n = 1. Data points are displayed as mean ± SD, and the p-values were evaluated by the Student’s t test. *p ≤ 0.05, ***p ≤ 0.001, ns is nonsignificant.

