. 2023 Aug 26;14(36):9933–9942. doi: 10.1039/d3sc03612j

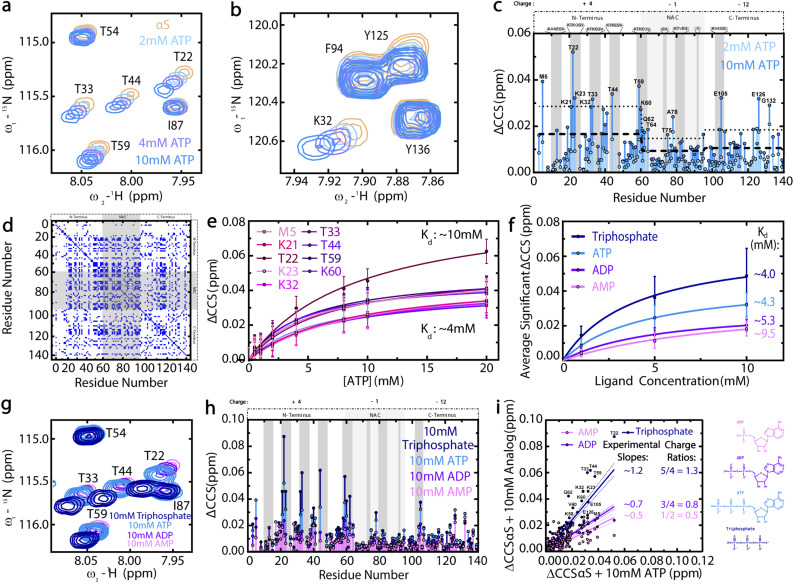
Fig. 3. The triphosphate moiety of ATP drives electrostatic interactions between ATP and the N-terminal pseudo-apolipoprotein repeats of WT αS. (a and b) 1H–15N HSQC spectral regions of WT αS monomers with increasing ATP concentrations. (c) ATP-induced Compounded Chemical Shifts (ΔCCS) of WT αS monomers, with ΔCCS greater than the region-specific average shift (dashed line) plus one standard deviation (dotted line) labelled. (d) Cos θ cross-peaks > 0.97 for αS WT (“apo”) versus 10 mM ATP-bound αS WT (“holo”). (e) 0–20 mM ATP-induced ΔCCS of significantly-shifted N-terminal αS residues fitted to a one-site specific binding model.38–40 Upper and lower-limit model-calculated Kd values are shown. (f) Average significant αS ΔCCS induced by AMP, ADP, ATP or triphosphate, fitted to one-site specific binding models and with approximate fitted Kd values shown. Error bars represent the standard deviation of well-resolved peaks at each concentration. (g) HSQC spectral regions used to calculate panel (h) ΔCCS. (h) αS ΔCCS induced by 10 mM AMP, ADP, ATP or triphosphate. The HSQC spectrum of αS in the presence of 10 mM ATP and the resulting ATP-induced αS ΔCCS profile shown in (a) and (c) are reproduced in (g) and (h), respectively, for ease of comparison. αS net regional charges are shown above panels (c) and (h), with dark grey boxes representing the “KTKEGV” αS repeats.17 (i) Correlations between 10 mM ATP-induced αS ΔCCS and those induced by 10 mM AMP, ADP or triphosphate. Approximate slopes are shown with lines of best fit and errors. Structures of AMP, ADP, ATP and triphosphate at pH 7.4 are shown. ΔCCS were calculated as ΔCCS = (0.5*((δHAMP, ADP, ATP or triphosphate − δHαS)2 + (0.15*(δNAMP, ADP, ATP or triphosphate − δNαS)2)))1/2.42.

Fig. 3