. 2023 Aug 26;14(36):9933–9942. doi: 10.1039/d3sc03612j

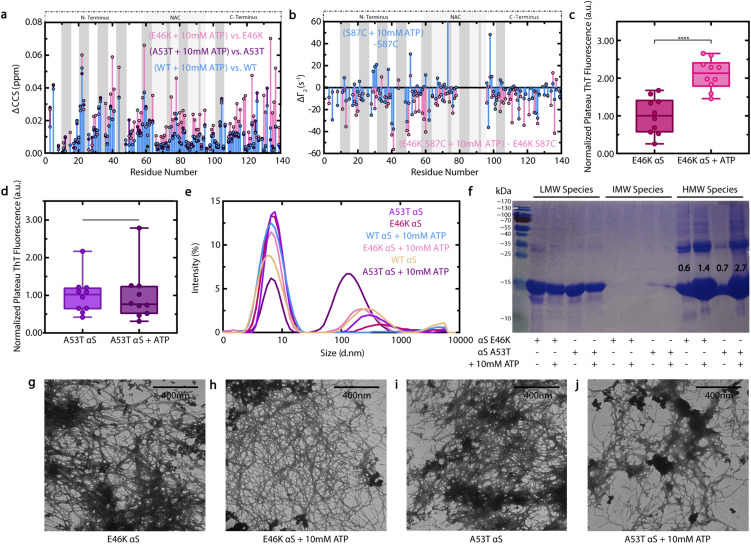
Fig. 7. Effect of ATP on E46K and A53T αS. (a) 10 mM ATP-induced ΔCCS of WT, E46K and A53T αS monomers, calculated relative to the corresponding variant alone. (b) PRE-derived Γ2 value differences induced by 10 mM ATP on spin-labelled, fresh 120 μM 15N S87C or S87C E46K αS, calculated relative to the corresponding S87C variant alone. The ten residues on either side of 87 are not shown. (c and d) Well-specific plateau ThT fluorescence measurements of fresh 300 μM E46K (c) or A53T (d) αS in ThT buffer +/− 10 mM ATP, normalized to the average measurement of the corresponding variant protein alone and incubated as for Fig. 2b. (e) DLS measurements of soluble αS from panels (c) and (d) plateau samples, following centrifugation to pellet large aggregates. (f) SDS-PAGE of soluble αS from panels (c) and (d) samples following centrifugation that were subsequently either retained by (IMW) or passed through (LMW) a Pall Nanostep 100 kDa centrifugal filter. Resuspended centrifugation pellets constitute HMW samples. Bands are in reference to PageRuler Prestained Protein Ladder (26616, Thermo Scientific), shown in the left-most lane. Numbers indicate a quantification of the ∼15 kDa monomer band intensities by ImageJ, expressed as the ratio of the HMW/LMW lane monomer bands for each sample. (g–j) Negative stain TEM images of pelleted large aggregates from panels (c) and (d) plateau samples: E46K (g) or A53T (i) αS alone or in the presence of 10 mM ATP (h and j). All scale bars represent lengths of 400 nm.

Fig. 7