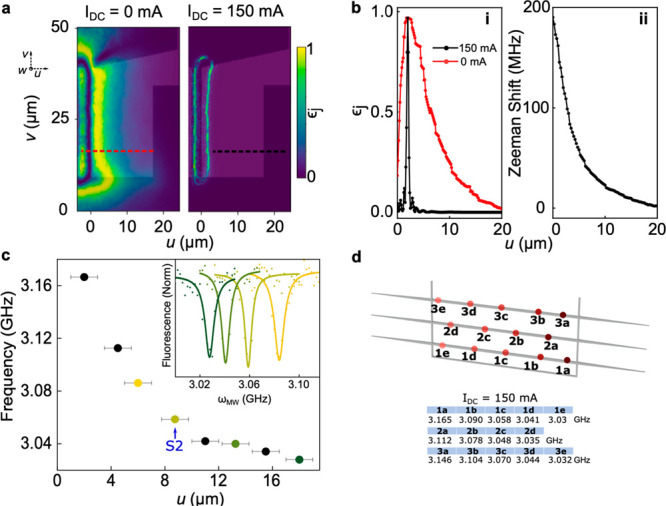
Figure 3.

(a) Simulated-state error εj with Idc values of 0 and 150 mA. (b) (i) Line cuts taken from panel a, showing the simulated εj as a function of u. (ii) Calculated Zeeman shift as a function of u for Idc = 150 mA. (c) Measured transition frequency, with Idc = 150 mA, for spins at different locations along a single diamond waveguide, as set by the optical excitation spot, exhibiting a position-dependent Zeeman shift. Error bars correspond to uncertainty in the location along the QMC. In the inset, a sample of ODMR measurements was used to determine the transition frequencies in the main plot. The spatially varying Zeeman shift allows for selective excitation of multiple spins. (d) Spins at different locations in the QMC are mapped to specific microwave frequency “addresses” for a given dc current. Experimentally measured frequency addresses are shown for multiple locations along three different diamond waveguides in our device (located between u = 0 and 14 μm). Waveguide 1 corresponds to the data shown in panel c.
