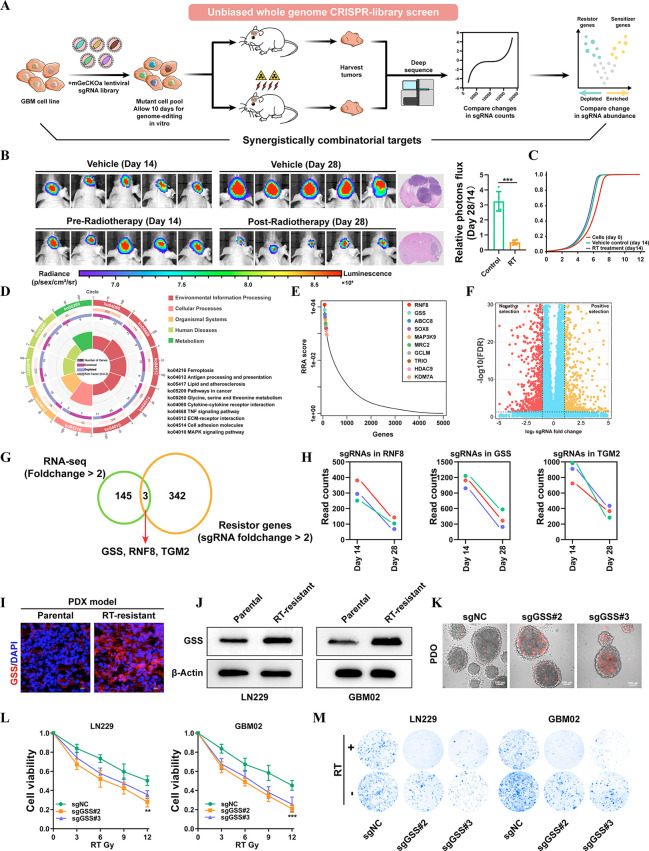
Figure 1.
In vivo CRISPR-Cas9–based screening identifies GSS as a critical mediator of radiotherapy resistance. (A) Schematics of the experimental design. (B) Tumor volume averaged for groups indicated. n = 5 per group. (C) Cumulative distribution function of library sgRNAs in the three transduced cell replicates. (D) Circos plots displaying CRISPR screen results. Significant screen hits are ranked on the outermost rim (p < 0.05) from most sensitizing to most resistance-associated. (E) Top ten positive hits from the screen according to the robust rank aggregation (RRA) score. (F) Volcano plot displaying the log2 fold change and adjusted P value for all sgRNAs identified in the screen. (G) Venn diagrams show overlapped essential driver genes for radioresistance. (H) Differences in sgRNA counts for GSS, RNF8, and TGM2 between vehicle and RT-treated mice. (I) The expression level of GSS in parental and RT-resistant PDX GBM model. (J) Immunoblots for the sensitive and resistant GBM cell lines, showing expression levels of GSS. (K) The radiosensitization of GSS in PDOs. (L) GSS-KO cells and control sgRNA transfected cells were treated for 72 h with a range of RT doses, after which a CCK-8 assay was used to assess cell viability relative to vehicle-treated cells. (M) Colony formation assays were conducted by plating GSS-KO or control cell lines (500 cells/well) and treating them with RT or vehicle control for 2 weeks (n = 3). *p < 0.05; **p < 0.01; ***p < 0.001; Student’s t test.

